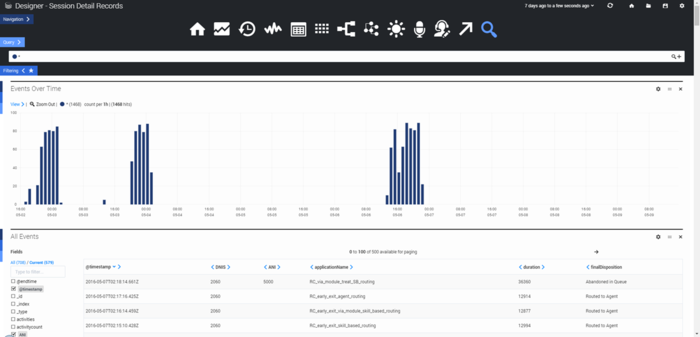
Session Detail Records
The Session Detail Records dashboard lets you view (and query) some of the raw data contained in the Session Detail Records (SDRs).
Reports on this dashboard
Events Over Time
Similar to Count Over Time, this report shows the number of events that were logged during the given time period.
All Events
Basically, this is a table showing raw data information for all application sessions that were active during the given time period. You can use the Fields check boxes to select which columns to display. You can then search the results for the selected columns by toggling the Query option and entering your own query.
Here's an example of a query statement:
=applicationName=Test 2 AND finalDisposition=System Error AND ANI=703-123-1234
This query would search the Test 2 application for sessions where the final disposition was System Error and the ANI was 703-123-1234.
After the results are generated, click an event to expand it. You can then view its details in Table, JSON, or Raw format. When an event is expanded, you can also use the Action menu to add/remove the item from the filter, or to add/remove that column from the table.

