Performance Counters (KPIs)
This article describes the basics of how Co-browse works together with the third-party Metrics Java library to provide reporting metrics about your server's Co-browse sessions. It also gives a walk-through of how to set up a sample JMX interface in order to view the metrics the Co-browse Server creates.
Contents
Co-browse and Metrics Library
Genesys Co-browse integrates with the third-party Metrics Java library, a toolkit that support all kinds of metrics out of the box: for example, counter, timer, histogram, and gauge.
This Metric library gives you several ways to report on current values: JMX (the main method), REST (for performance testing), and Logging.
About Co-browse Metrics
Starting with release 8.5.100.05, the Co-browse Server integrates with the Metrics Library client for the Java Management Extensions (JMX) reporter interface. JMX lets you observe Co-browse metrics using JMX tools.
Co-browse Server 8.5.002 extended metrics functionality to support logging to a file and the console.
Overview of Available Co-browse Metrics
Co-browse Server generates these kinds of metrics:
- Current count of sessions in different states (counter metric)
- Count of completed sessions since the start of the server (counter metric)
- Session timings (timer/histogram)
- Agent overall rendering time (histogram)
- Agent stages rendering time (histogram)
- Co-browse session initialization on server side (timer)
- Time of Customer, Agent, and Controller joining to the Co-browse session (timer)
- Sessions interrupted without accept (counter metric).
Breakdown of Available Co-browse Metrics
| Metric name | Description | Added in version: |
|---|---|---|
| ActiveSessions | Sessions set to "Activated" status when session is created by Customer and joined by Agent | 8.5.001 |
| CanceledInactiveSessions | Sessions canceled by initiator | 8.5.001 |
| InactiveSessions | Sessions set to "Inactive" status when session is created by Customer but waiting for Agent to join | 8.5.001 |
| LiveSessions | All sessions in statuses "Inactive" or "Activated". | 8.5.001 |
| NormallyEndedActiveSessions | Sessions ended during period of two sides Co-browse activity | 8.5.001 |
| TerminatedByUserDisconnectionSessions | Sessions ended through User timeout disconnect | 8.5.001 |
| TimeoutedInactiveSessions | Sessions ended by timeout in awaiting for Agent connection | 8.5.001 |
| TotalFinishedSessions | Total count of all finished sessions | 8.5.001 |
| CreateSessionAverage | Histogram showing the timings for session creation on the server side | 8.5.001 |
| JoinSessionAverage | Histogram showing the timings for the server join procedure for each member in a Co-browse activity | 8.5.001 |
| SlaveInitAverage | Histogram showing the timings for Agent initialization after a page reload with session ID | 8.5.001 |
| SlaveGetSessionAverage | Histogram showing the timings for the Agent to obtain the session environment after a page reload with session ID | 8.5.001 |
| SlaveHandshakeAverage | Histogram showing the timings for the Agent handshake via CometD after a page reload with session ID | 8.5.001 |
| SlaveJoinAverage | Histogram showing the timings for the Agent to join a session after a page reload with session ID | 8.5.001 |
| SlavePageDataAverage | Histogram of timing for Agent got page data since page reload with session ID | 8.5.001 |
| SlaveRenderAverage | Histogram showing the timings for the Agent to fully render after a page reload with session ID | 8.5.001 |
| ServerResponseTime | Histogram showing the average timings for the latest N routings of data from customer browser to agent browser, where N is defined by the ServerResponseTime.slidingWindowSize option value. | 8.5.002 |
How To Expose Co-browse metrics through the JMX interface
There are many JMX tools that you can use to observe the metrics Co-browse Server creates:
- JConsole tool bundled with Oracle Java (TM)
- EJTools JMX Browser
- Panoptes
- jManage
- MC4J
- Zabbix
Using JConsole to Observe Co-browse Metrics
To use JConsole to view Co-browse metrics:
Connect JConsole to Co-browse Server
Connecting JConsole to Co-browse Server depends on the Co-browse Server process:
- Connect to Co-browse started as a local java process
- Connect to Co-browse started as a server
- Connect to Co-browse started as a Windows service
Connect to Co-browse started as a local java process
- Run jconsole.exe from the <jdk>/bin directory.
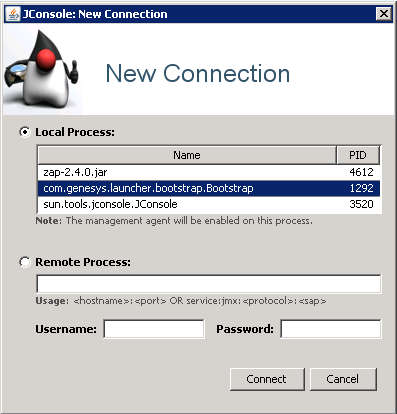
In the New Connection dialog, specify the Co-browse launcher java process.
If the Co-browse Server was started using a .bat file in the same host where JMX console is opened, specify the following process from the Local Process list:
com.genesys.launcher.bootstrap.Bootstrap
Connect to Co-browse started as a server
If the Co-browse Server was started remotely as a server, follow these steps:
- Run jconsole.exe from the <jdk>/bin directory.
- Open setenv.bat and uncomment all lines under
:: Uncomment for enabling JMX Remote. Memorize JMX port.
- Save your changes.
- Restart the Co-browse Server application.
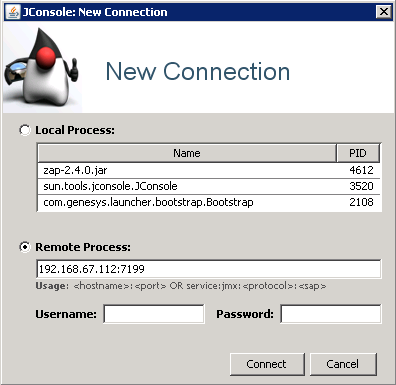
- Specify host:<JMX port> in the Remote Process section:
Connect to Co-browse started as a Windows service
If you started Co-browse Server as a Windows service, first stop the service, reinstall it, and start it again, as follows:
- Stop the service.
- Open setenv.bat and find the service name in the line set SVC_NAME=
- Run this command:
cobrowse.bat -service SERVICENAME remove
- to remove the service.
- Open setenv.bat and uncomment all lines under
:: Uncomment for enabling JMX Remote. Memorize JMX port.
- Save your changes.
- Run this command:
cobrowse.bat -service SERVICENAME install
- to install the service.
- Start the service.
- Specify host:<JMX port> from the Remote Process section, see above.
Once you connect to JConsole to Co-browse Server, you can open the JMX panel to view the metrics.
Open the JMX panel to view the metrics
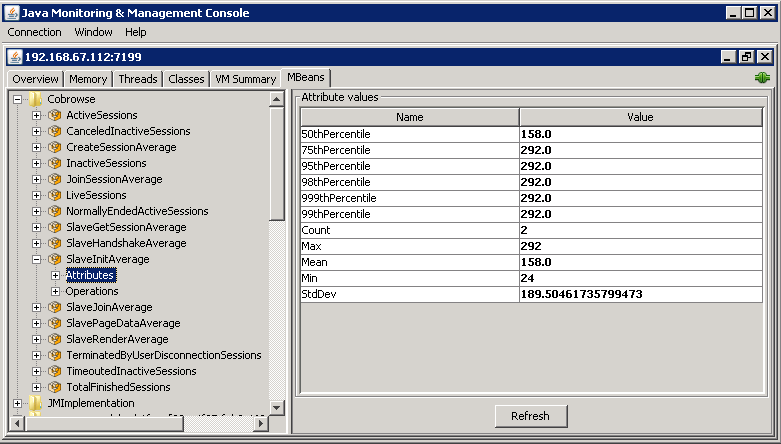
- Click Connect in the New Connection dialog. The JMX panel opens.
- Open the MBeans tab and expand the Cobrowse branch. All Co-browse metrics are there.
- To refresh the metrics, click Refresh.
Configuring logging reporter for metrics
Co-browse Server release 8.5.002 extends metric functionality to support logging to a file and to the console.
To configure the logging reporter to log to a file or to the console:
Logging to a file
To enable logging to a file:
metrics section
In the metrics section of your Co-browse Cluster application configure the following:
- Set reporter.log.enabled to true (false by default)
- Configure reporter.log.logFrequency (default value is 30min )
log section
In the Co-browse Node application log section configure the following:
Logging to the console
To enable logging to the console:
metrics section
In the metrics section of you Co-browse Cluster application configure the following:
- Set reporter.console.enabled to true (false by default)
- Configure reporter.console.logFrequency (default value is 30min)
log section
In the Co-browse Node application log section configure the following:


