Viewing your reports (v8)
While you are working in the GPlus Adapter for Salesforce, you can view reports and statistics at any time. This information is important for you to see so that you can gauge the call wait times and monitor your Key Performance Indicators (KPIs).
Contents
Reports and statistics are available to you through the main menu. You can access the following adapter views:
Reports view
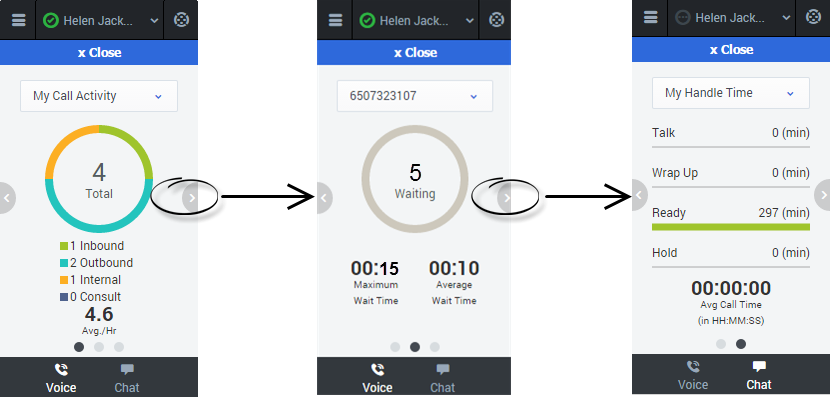
The Reports view for voice interactions displays two pages: My Call Activity and My Handle Time. To navigate between the pages, use the arrows on the left and right side of the adapter.
- On the My Call Activity page, you can view a diagram that represents the averages of calls per hour and call time. Call Activity metrics include Total calls, Inbound calls, Outbound calls, Internal calls, and Consult calls.
- On the queue statistics page, you can select a queue from the drop-down list and see corresponding statistics such as the number of calls waiting, the maximum wait time, and the average wait time.
- On the My Handle Time page, you see metrics (in minutes) for Total time, Talk time, Wrap Up time, Ready time, and Hold time.
My Statistics view
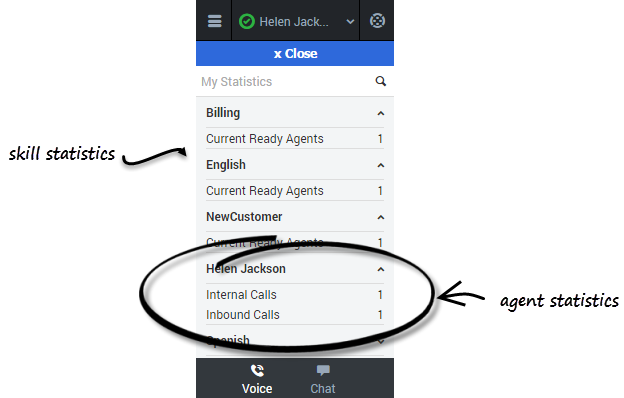
The My Statistics page of the adapter displays the list of your statistics, otherwise known as Key Performance Indicators (KPIs).
You can access the My Statistics page from the main menu at the top corner of the adapter. The statistics that you see depend on how your administrator has configured your account. For example, you might see agent statistics, skill statistics, and queue statistics. If your adapter does not include a My Statistics option on the main menu, your administrator might not have added any statistics to your agent account. In this case, contact your administrator.
You can expand sections by clicking the arrows next to the section title.
You can also type a value into the search field to filter the list of statistics that are displayed.
Note: Statistics about the Routing Points, Queues, and so on, are displayed in the Contact Center Statistics tab.
Contact Center Statistics view
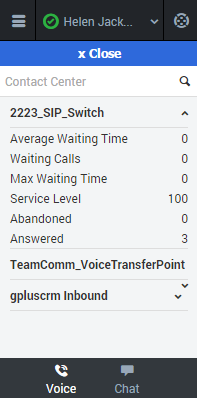
The Contact Center page on the adapter displays a summary of your Routing Point metrics, which might include:
- Average Waiting Time
- Waiting Calls
- Max Wait Time
- Service Level
- Abandoned
- Answered
Your adapter might display more, or fewer, metrics depending on how your administrator has configured the Contact Center Statistics view.
You can also type a value into the search field to filter the list of statistics that are displayed.


