
GIR LNX 75.png
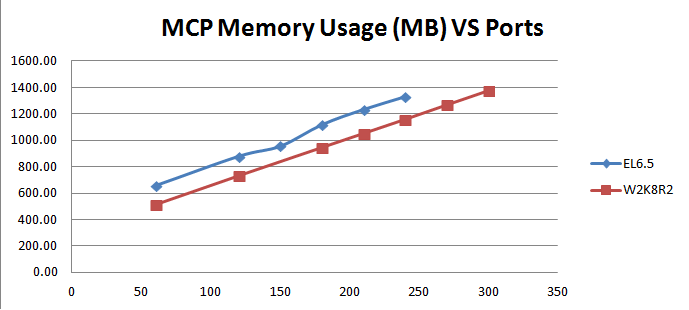
= frame|none|500px|Figure 75: Comparison of MCP Memory Usage on Physical Server, MP3 16kbps without encryption, RH EL 6.5 vs Windows 2008 R2
It can be observed more resources (CPU, memory etc) will be used on Linux than Windows so that lower capacity is achieved on Linux with 37.5% reduction (150 vs 240) for preferred ports and 22.2% reduction (210 vs 270) for peak ports.
Below are two graphs to compare audio quality in terms of max jitter and max delta:
[[File: GIR_LNX_76.png |frame|none|500px|Figure 76: Comparison of Max Jitter on Physical Server, MP3 16kbps without encryption, RH EL 6.5 vs Windows 2008 R2
[[File: GIR_LNX_77.png |frame|none|500px|Figure 77: Comparison of Max Delta on Physical Server, MP3 16kbps without encryption, RH EL 6.5 vs Windows 2008 R2 It can be seen that Max Jitter is somewhat close between Windows and Linux, however, Linux has lower value at lower ports and slightly higher value on higher ports. The Max Delta shows Linux has the higher value even it is almost the same for both Windows and Linux at lower ports.
System disk IOPS is illustrated in below table for Linux EL 6.5:
| Ports | Disk IOPS Physical Server | ||
| Total | Reads | Writes | |
| 60 | 12.75 | 0.000 | 12.754 |
| 120 | 23.12 | 0.000 | 23.117 |
| 150 | 27.65 | 0.000 | 27.645 |
| 180 | 32.15 | 0.000 | 32.150 |
| 210 | 36.73 | 0.000 | 36.729 |
| 240 | 41.57 | 0.000 | 41.568 |
Take Figure 78 to compare Linux with Windows in Figure 45, we have graph below:
[[File: GIR_LNX_79.png |frame|none|500px|Figure 79: Comparison of System Disk IOPS on Physical Server, MP3 16kbps without encryption, RH EL 6.5 vs Windows 2008 R2
It can be seen that IOPS on both Windows and Linux are quite inline each other which can be concluded that Disk IOPS is related to test profile and irrelevant to particular OS. So the IOPS numbers from previous Windows testing can be used generally for both Windows and Linux.
Contents
5.2.2 VMs on Dual Hex Cores Server
This is Test Profile 1a on Hardware Profile 4 with VM Profile 4 for virtual machine env. Here are the three graphs illustrating overall system CPU usage, MCP CPU usage and memory usage:
[[File: GIR_LNX_80.png |frame|none|500px|Figure 80: Comparison of System CPU Usage on VM env, MP3 16kbps without encryption, RH EL 6.5 vs Windows 2008 R2
It shows same trend as observed from the physical server results in the previous section that Linux consumes more CPU resources. Below two graphs of audio quality related metrics also shows the same thing.
[[File: GIR_LNX_81.png |frame|none|500px|Figure 81: Comparison of Max Jitter on VM env, MP3 16kbps without encryption, RH EL 6.5 vs Win 2008 R2
[[File: GIR_LNX_82.png |frame|none|500px|Figure 82: Comparison of Max Delta on VM env, MP3 16kbps without encryption, RH EL 6.5 vs Windows 2008 R2
As observed on above graphs, 540 ports are recommended and preferred which is however 25% reduction to compare with Windows 2008 R2 (540 vs 720). Peak capacity would be 660 ports which is 21.4% reduction compare to Windows 2008 R2 (660 vs 840). The similar reductions are also observed on physical server in the previous section.
The disk IOPS is displayed here:
| Ports | Overall 6 VMs Disk IOPS | SSD Drive Disk IOPS | ||||
| Total | Reads | Writes | Total | Reads | Writes | |
| 120 | 28.17 | 0.00 | 28.17 | 24.011 | 0.000 | 24.011 |
| 240 | 49.78 | 0.00 | 49.78 | 44.590 | 0.000 | 44.590 |
| 360 | 71.11 | 0.00 | 71.11 | 65.747 | 0.000 | 65.747 |
| 420 | 81.59 | 0.00 | 81.59 | 76.058 | 0.000 | 76.058 |
| 480 | 92.37 | 0.00 | 92.37 | 86.767 | 0.000 | 86.767 |
| 540 | 102.96 | 0.00 | 102.96 | 97.305 | 0.000 | 97.305 |
| 600 | 112.33 | 0.00 | 112.33 | 106.727 | 0.000 | 106.727 |
| 660 | 122.06 | 0.00 | 122.06 | 116.440 | 0.000 | 116.440 |
| 720 | 130.82 | 0.00 | 130.82 | 125.121 | 0.000 | 125.121 |
To compare the above table with the table in Figure 52 for Windows for the same MP3 only 16 kbps profile, we have graph below:
[[File: GIR_LNX_84.png |frame|none|500px|Figure 84: Comparison of System Disk IOPS on VM env, MP3 16kbps without encryption, RH EL 6.5 vs Windows 2008 R2
It can be seen the disk IOPS is quit close to each between Linux and Windows which is what observed on physical server in previous section.
The data throughputs for this MP3 only profile on EL 6.5 is illustrated here:
| Ports | Overall Disk KB/sec | SSD Drive Disk KB/sec | ||||
| Total KB/sec | Read KB/sec | Write KB/sec | Total KB/sec | Read KB/sec | Write KB/sec | |
| 120 | 417.70 | 0.00 | 417.70 | 389.474 | 0.000 | 389.474 |
| 240 | 788.58 | 0.00 | 788.58 | 751.418 | 0.000 | 751.418 |
| 360 | 1145.77 | 0.00 | 1145.77 | 1104.237 | 0.000 | 1104.237 |
| 420 | 1317.38 | 0.00 | 1317.38 | 1274.484 | 0.000 | 1274.484 |
| 480 | 1496.20 | 0.00 | 1496.20 | 1451.114 | 0.000 | 1451.114 |
| 540 | 1677.83 | 0.00 | 1677.83 | 1627.798 | 0.000 | 1627.798 |
| 600 | 1843.65 | 0.00 | 1843.65 | 1795.706 | 0.000 | 1795.706 |
| 660 | 2023.36 | 0.00 | 2023.36 | 1974.070 | 0.000 | 1974.070 |
| 720 | 2193.62 | 0.00 | 2193.62 | 2142.769 | 0.000 | 2142.769 |
5.3 Comparison MP3 only and MP3 + WAV
5.3.1 Physical Server on Single Hex Core
This is Test Profile 2a (MP3 16 kbps + wav without encryption) on Hardware Profile 1 for physical server which Test Profile 1a (MP3 only 16 kbps without encryption) is used as baseline to compare with. Here are the three graphs illustrating overall system CPU usage, MCP CPU usage and memory usage:
[[File: GIR_LNX_86.png |frame|none|500px|Figure 86: Comparison of System CPU Usage on Physical Server, MP3 + wav vs MP3 only, on RH EL 6.5
[[File: GIR_LNX_87.png |frame|none|500px|Figure 87: Comparison of MCP CPU Usage on Physical Server, MP3 + wav vs MP3 only, on RH EL 6.5
[[File: GIR_LNX_88.png |frame|none|500px|Figure 88: Comparison of MCP Memory Usage on Physical Server, MP3 + wav vs MP3 only, on RH EL 6.5 They show apparent higher MCP and overall system CPU usage for MP3 + wav profile, however, the MCP memory usage seems quite close to each other. And the audio quality metric also shows some differences below:
[[File: GIR_LNX_89.png |frame|none|500px|Figure 89: Comparison of Max Jitter on Physical Server, MP3 + wav vs MP3 only, on RH EL 6.5
[[File: GIR_LNX_90.png |frame|none|500px|Figure 90: Comparison of Max Delta on Physical Server, MP3 + wav vs MP3 only, on RH EL 6.5 As can be observed from above graphs lower capacities would be achieved for MP3 + wav profile. 90 ports would be recommended and preferred which is 40% reduction (90 vs 150) comparing with MP3 only profile while 150 would be peak capacity which is 28.6% reduction (150 vs 210).
System disk IOPS is listed in following table:
| Ports | Physical Server Disk IOPS | ||
| Total | Reads | Writes | |
| 30 | 15.18 | 0.008 | 15.17 |
| 60 | 26.70 | 0.000 | 26.70 |
| 90 | 35.53 | 0.003 | 35.53 |
| 120 | 46.04 | 0.002 | 46.04 |
| 150 | 55.44 | 0.000 | 55.44 |
| 180 | 65.50 | 1.520 | 63.98 |
The graph below shows the comparison of disk IOPS with MP3 only profile:
[[File: GIR_LNX_92.png |frame|none|500px|Figure 92: Comparison of System Disk IOPS on Physical Server, MP3 + wav vs MP3 only, on RH EL 6.5
It shows almost double disk IOPS for MP3 + wav profile which was observed similarly in the previous Windows testing.
5.3.2 VMs on Dual Hex Cores Server
Similar trend of overall CPU usage is also observed on VM env.
[[File: GIR_LNX_93.png |frame|none|500px|Figure 93: Comparison of System CPU Usage on VM env, MP3 + wav vs MP3 only, on RH EL 6.5
The audio quality metrics also shows similar trends observed on physical server>
[[File: GIR_LNX_94.png |frame|none|500px|Figure 94: Comparison of Max Jitter on VM env, MP3 + wav vs MP3 only, on RH EL 6.5
[[File: GIR_LNX_95.png |frame|none|500px|Figure 95: Comparison of Max Delta on VM env, MP3 + wav vs MP3 only, on RH EL 6.5
The 480 ports are recommended and preferred for this MP3 + wav profile which is 11.1% reduction (480 vs 540 for MP3 only) while peak would be 660 which is only 9.1% reduction (600 vs 660 for MP3 only).
Below is the table to illustrate overall 6 VMs disk IOPS:
| Ports | Overall 6 VMs Disk IOPS | SSD Drive Disk IOPS | ||||
| Total | Reads | Writes | Total | Reads | Writes | |
| 120 | 52.99 | 0.00 | 52.99 | 48.728 | 0.000 | 48.728 |
| 240 | 100.50 | 0.00 | 100.50 | 95.174 | 0.000 | 95.174 |
| 360 | 144.34 | 0.00 | 144.34 | 138.864 | 0.000 | 138.864 |
| 420 | 164.65 | 0.00 | 164.65 | 158.979 | 0.000 | 158.979 |
| 480 | 183.45 | 0.00 | 183.45 | 177.711 | 0.000 | 177.711 |
| 540 | 207.27 | 0.00 | 207.27 | 201.564 | 0.000 | 201.564 |
| 600 | 224.97 | 0.00 | 224.97 | 219.197 | 0.000 | 219.197 |
| 660 | 275.49 | 0.00 | 275.49 | 269.584 | 0.000 | 269.584 |
| 720 | 187.34 | 0.00 | 187.33 | 179.984 | 0.001 | 179.983 |
Comparing with MP3 only profile, overall 6 VM disk IOPS for MP3 + wav profile also shows almost double IOPS as showed in the previous physical server section.
[[File: GIR_LNX_97.png |frame|none|500px|Figure 97: Comparison of System Disk IOPS on VM env, MP3 + wav vs MP3 only, on RH EL 6.5
Below table is illustrated overall data throughputs for this MP3 + wav profile on VMs of RH EL 6.5 env.
| Ports | Overall Disk KB/sec | SSD Drive Disk KB/sec | ||||
| Total KB/sec | Read KB/sec | Write KB/sec | Total KB/sec | Read KB/sec | Write KB/sec | |
| 120 | 2376.30 | 0.00 | 2376.30 | 2347.222 | 0.000 | 2347.222 |
| 240 | 4684.79 | 0.00 | 4684.79 | 4646.371 | 0.000 | 4646.371 |
| 360 | 6975.83 | 0.00 | 6975.83 | 6933.441 | 0.000 | 6933.441 |
| 420 | 8100.79 | 0.00 | 8100.79 | 8056.843 | 0.001 | 8056.842 |
| 480 | 9242.32 | 0.00 | 9242.32 | 9195.871 | 0.001 | 9195.871 |
| 540 | 10391.78 | 0.00 | 10391.78 | 10344.249 | 0.001 | 10344.249 |
| 600 | 11512.54 | 0.00 | 11512.54 | 11462.150 | 0.001 | 11462.149 |
| 660 | 12804.19 | 0.01 | 12804.18 | 12752.305 | 0.001 | 12752.304 |
| 720 | 9380.58 | 0.00 | 9380.58 | 9336.194 | 0.003 | 9336.191 |
5.4 Encryption
5.4.1 MP3 16 kbps Only on Physical Server of Single Hex Core
This is Test Profile 3a (MP3 16 kbps only with encryption) on Hardware Profile 1 for physical server which Test Profile 1a (MP3 only 16 kbps without encryption) is used as baseline to compare with. Here are the three graphs illustrating overall system CPU usage, MCP CPU usage and memory usage:
[[File: GIR_LNX_98.png |frame|none|500px|Figure 99: Comparison of System CPU Usage on Physical Server, MP3 only 16 kbps encryption vs non encryption, on RH EL 6.5
[[File: GIR_LNX_99.png |frame|none|500px|Figure 100: Comparison of MCP CPU Usage on Physical Server, MP3 only 16 kbps encryption vs non encryption, on RH EL 6.5
[[File: GIR_LNX_101.png |frame|none|500px|Figure 101: Comparison of MCP Memory Usage on Physical Server, MP3 only 16 kbps encryption vs non encryption, on RH EL 6.5
It can be observed that both system CPU and MCP CPU are quite inline to each other between encryption and non encryption profiles while MCP memory for encryption is slightly higher than non encryption.
Let us look at audio quality metrics further:
[[File: GIR_LNX_102.png |frame|none|500px|Figure 102: Comparison of Max Jitter on Physical Server, MP3 only, Encryption vs Non Encryption on EL 6.5
Figure 103: Comparison of Max Delta on Physical Server, MP3 only, Encryption vs Non Encryption on EL 6.5
It can be seen that Max Jitter is quite similar to each other for both encryption and non encryption scenarios. So is Max Delta metris. So the preferred ports (540) and peak ports (660) for encryption are the same as non encryption profile.
For system disk IOPS, it is illustrated below:
| Ports | Physical Server Disk IOPS | ||
| Total | Reads | Writes | |
| 30 | 8.12 | 0.000 | 8.122 |
| 60 | 14.22 | 0.000 | 14.220 |
| 90 | 19.98 | 0.000 | 19.975 |
| 120 | 25.12 | 0.000 | 25.122 |
| 150 | 30.62 | 0.000 | 30.621 |
| 180 | 35.07 | 0.000 | 35.074 |
| 210 | 39.83 | 0.000 | 39.828 |
| 240 | 44.74 | 0.000 | 44.739 |
To compare it with non encryption scenario in Figure 78, we have the graph below:
[[File: GIR_LNX_105.png |frame|none|500px|Figure 105: Comparison of System Disk IOPS on Physical Server, MP3 only, on EL 6.5, Encryption vs Non Encryption
Slightly higher system disk IOPS can be observed on encryption scenario which should be caused by extra key/pem files for encryption.
5.4.2 MP3 16 kbps Only on VMs of Dual Hex Cores This is Test Profile 3a (MP3 16 kbps only with encryption) on VM Profile 4 of Hardware Profile 1 for VM env to compare Test Profile 1a (MP3 only 16 kbps without encryption) on the same HW spec. Below are the graphs illustrating overall system CPU usage and memory usage:
[[File: GIR_LNX_106.png |frame|none|500px|Figure 106: Comparison of System CPU Usage on VMs, MP3 only 16 kbps encryption vs non encryption, on RH EL 6.5
[[File: GIR_LNX_107.png |frame|none|500px|Figure 107: Comparison of MCP Memory Usage on VMs, MP3 only 16 kbps encryption vs non encryption, on RH EL 6.5
As observed similarly in previous physical server graphs, CPU usage is almost the same for both encryption and non encryption while MCP memory usage is slightly higher for encryption scenario.
Let us look at audio quality metrics too:
[[File: GIR_LNX_108.png |frame|none|500px|Figure 108: Comparison of Max Jitter on VMs, MP3 only, Encryption vs Non Encryption on EL 6.5
[[File: GIR_LNX_109.png |frame|none|500px|Figure 109: Comparison of Max Delta on VMs, MP3 only, Encryption vs Non Encryption on EL 6.5
It can be observed similar trends in previous physical server section that both encryption and non encryption got similar value for both Max Jitter and Max Delta. So the preferred ports (540) and peak ports (660) for encryption would be the same as non encryption profile.
| Ports | Overall 6 VMs Disk IOPS | SSD Drive Disk IOPS | ||||
| Total | Reads | Writes | Total | Reads | Writes | |
| 120 | 30.44 | 0.00 | 30.44 | 25.997 | 0.000 | 25.997 |
| 240 | 53.41 | 0.00 | 53.41 | 47.939 | 0.000 | 47.939 |
| 360 | 75.57 | 0.00 | 75.57 | 70.011 | 0.000 | 70.011 |
| 420 | 86.37 | 0.00 | 86.37 | 80.600 | 0.000 | 80.600 |
| 480 | 97.32 | 0.00 | 97.32 | 91.564 | 0.000 | 91.564 |
| 540 | 108.20 | 0.00 | 108.20 | 102.393 | 0.000 | 102.393 |
| 600 | 117.95 | 0.00 | 117.95 | 112.132 | 0.000 | 112.132 |
| 660 | 127.85 | 0.00 | 127.85 | 121.911 | 0.000 | 121.911 |
| 720 | 136.85 | 0.00 | 136.85 | 130.951 | 0.000 | 130.951 |
To compare it with non encryption scenario in Figure 83, we have graph below:
[[File: GIR_LNX_111.png |frame|none|500px|Figure 111: Comparison of System Disk IOPS on VM env, MP3 only, on EL 6.5, Encryption vs Non Encryption
It shows similar picture as observed in previous physical server section that slight higher system disk IOPS for encryption than non encryption scenario.
Data throughputs are illustrated in below table:
| Ports | Overall Disk KB/sec | SSD Drive Disk KB/sec | ||||
| Total KB/sec | Read KB/sec | Write KB/sec | Total KB/sec | Read KB/sec | Write KB/sec | |
| 120 | 435.55 | 0.00 | 435.55 | 403.192 | 0.000 | 403.192 |
| 240 | 822.06 | 0.00 | 822.06 | 780.379 | 0.000 | 780.379 |
| 360 | 1186.43 | 0.00 | 1186.43 | 1140.874 | 0.000 | 1140.874 |
| 420 | 1359.14 | 0.00 | 1359.14 | 1311.668 | 0.000 | 1311.668 |
| 480 | 1549.49 | 0.00 | 1549.49 | 1500.982 | 0.000 | 1500.982 |
| 540 | 1719.89 | 0.00 | 1719.89 | 1669.506 | 0.000 | 1669.506 |
| 600 | 1905.09 | 0.00 | 1905.09 | 1853.208 | 0.000 | 1853.208 |
| 660 | 2081.23 | 0.00 | 2081.23 | 2027.495 | 0.000 | 2027.495 |
| 720 | 2269.56 | 0.00 | 2269.56 | 2214.658 | 0.000 | 2214.658 |
5.4.3 MP3 16 kbps + wav on VMs of Dual Hex Cores This is Test Profile 4a (MP3 16 kbps + wav with encryption) on VM Profile 4 of Hardware Profile 1 for VM env to compare Test Profile 2a (MP3 16 kbps + wav without encryption) on the same HW spec. Below are the three graphs illustrating overall system CPU usage and memory usage:
[[File: GIR_LNX_113.png |frame|none|500px|Figure 113: Comparison of System CPU Usage on VMs, MP3 16 kbps + wav encryption vs non encryption, on RH EL 6.5
[[File: GIR_LNX_114.png |frame|none|500px|Figure 114: Comparison of MCP Memory Usage on VMs, MP3 16 kbps + wav encryption vs non encryption, on RH EL 6.5
It can be seen from above graphs that system CPU usage is quite close to each other for both encryption and non encryption scenarios while MCP memory usage for encryption is slight higher than non encryption scenario, which is also observed similarly in the previous MP3 only scenarios.
And audio quality metrics of Max Jitter and Max Delta also shows similar trends as observed previously.
[[File: GIR_LNX_115.png |frame|none|500px|Figure 115: Comparison of Max Jitter on VMs, MP3 + wav, Encryption vs Non Encryption on EL 6.5
[[File: GIR_LNX_116.png |frame|none|500px|Figure 116: Comparison of Max Delta on VMs, MP3 + wav, Encryption vs Non Encryption on EL 6.5
Based on above, the recommended and preferred ports for encryption of MP3 + wav would be 480 as same as non encryption of MP3 + wav. So is the peak ports which is 600.
Overall system disk IOPS shows in below table as reference:
| Ports | Overall 6 VMs Disk IOPS | SSD Drive Disk IOPS | ||||
| Total | Reads | Writes | Total | Reads | Writes | |
| 120 | 53.97 | 0.00 | 53.97 | 49.506 | 0.000 | 49.506 |
| 240 | 102.98 | 0.00 | 102.98 | 97.468 | 0.000 | 97.468 |
| 360 | 149.87 | 0.00 | 149.87 | 144.235 | 0.000 | 144.235 |
| 420 | 171.89 | 0.00 | 171.89 | 166.144 | 0.000 | 166.144 |
| 480 | 196.97 | 0.00 | 196.97 | 191.140 | 0.000 | 191.140 |
| 540 | 223.52 | 0.01 | 223.51 | 217.663 | 0.000 | 217.663 |
| 600 | 246.26 | 0.03 | 246.22 | 240.216 | 0.000 | 240.216 |
| 660 | 296.60 | 0.00 | 296.60 | 290.582 | 0.000 | 290.582 |
Comparing it with non encryption scenario in Figure 97, we can have the graph:
[[File: GIR_LNX_118.png |frame|none|500px|Figure 118: Comparison of System Disk IOPS on VM env, MP3 + wav, on EL 6.5, Encryption vs Non Encryption It shows the same trend as observed previously in this section.
Data throughputs are also listed below as reference:
| Ports | Overall Disk KB/sec | SSD Drive Disk KB/sec | ||||
| Total KB/sec | Read KB/sec | Write KB/sec | Total KB/sec | Read KB/sec | Write KB/sec | |
| 120 | 2421.76 | 0.00 | 2421.76 | 2373.612 | 0.000 | 2373.612 |
| 240 | 4756.37 | 0.00 | 4756.37 | 4699.737 | 0.000 | 4699.737 |
| 360 | 7065.62 | 0.00 | 7065.62 | 7004.491 | 0.000 | 7004.491 |
| 420 | 8179.23 | 0.00 | 8179.23 | 8116.591 | 0.000 | 8116.591 |
| 480 | 9366.53 | 0.00 | 9366.53 | 9301.426 | 0.000 | 9301.426 |
| 540 | 10489.26 | 0.14 | 10489.12 | 10423.230 | 0.000 | 10423.230 |
| 600 | 11647.29 | 0.78 | 11646.51 | 11574.973 | 0.000 | 11574.973 |
| 660 | 12976.30 | 0.06 | 12976.24 | 12905.764 | 0.001 | 12905.763 |
[[Category:V:GVP:85 =
File history
Click on a date/time to view the file as it appeared at that time.
| Date/Time | Thumbnail | Dimensions | User | Comment | |
|---|---|---|---|---|---|
| current | 03:52, February 19, 2015 | | 689 × 310 (21 KB) | Sschlich (talk | contribs) |
- You cannot overwrite this file.
File usage
The following 6 pages link to this file: