Bgrenon/11
How do I add reports to my dashboard?
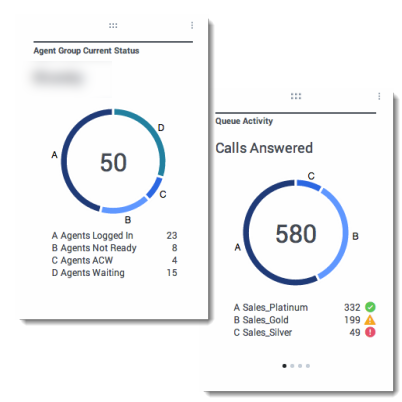
It's easy to add a new report within a Pulse widget. Pulse provides a basic set of predefined templates, complete with statistics that are typical for reporting activities handled by Genesys solutions. Any users with the appropriate privileges can create or modify widgets and templates.
Contents
How do I add reports to a dashboard?
There are two ways you can add a report to your dashboard:
- Click on the more icon in the right corner of the dashboard and click Add a Widget.
- Click on the Add a Widget icon on the dashboard.
Pulse opens a widget wizard to help you add a report.
How do I use the widget wizard?
The widget wizard guides you through the process of creating or changing widgets. Choose a predefined widget template or define your own template.
To create a Pulse template, you must add or configure:
- One or more object types to measure.
- One or more statistics.
- One widget type with specific display options.
How do I choose which objects to measure?
Select the objects that you want to see in your report.
How do I choose statistics?
Choose the statistics that you want to include in your widget. You must add at least one non-string statistic.
Pulse displays statistic details when you select a statistic.You can modify a statistic definition within Pulse when you create, clone, or edit a template.
Pulse statistics are described in detail in the templates.xls file.
What display options should I use?
You need to define the default display settings for your widget. Users can change these options on their own dashboard.
- Provide a name for report title.
- Select the Widget Type to display.
- Select the Widget refresh rate.
- Select options associated with the visualization (for example, alerts and size).
- If needed, select the Alerts for statistic and define the alert values (from 1 to 3).
Why are my Agent Login statistics missing?
Pulse doesn't show data in the Agent Login template for the Service Type, Customer Segment, Service Sub Type, and Business Result metrics in order to filter out User Data from the Reason Codes provided in the Reason metric.
To see these metrics in your report data, clone the Agent Login template, edit the Current Status metric and select the User Data check-box. Then create a new widget from your cloned template.
Because the User Data is also added to the Reason metric, you might also decide to delete that metric.


