Contents
Monitoring Alarms
A monitoring alarm is an alert that signals a problem discovered in Co-browse Server.
Application servers produce predefined and generic monitoring alarms.
Predefined monitoring alarms include:
- Heap Memory Usage
- GC Frequency
- GC Latency
- Inactive Sessions
- Jetty Thread Pool Usage
- Server Response Time
- Slave Render Latency
The criteria Co-browse Server uses to detect and cancel a problem depend on the monitored metric's specified threshold.
Thresholds
A threshold is the basic element used to implement all generated monitoring alarms.
Each threshold is described by the following parameters:
- JMX metric
- Threshold type, predefined or generic
- Related option in the metrics section of the Co-browse Server's configuration
- Log Event ID for detect event
- Log Event ID for cancel event
Predefined thresholds
Alert generations use predefined thresholds when threshold parameters like metric, Detect Log ID, and Cancel Log ID are predefined and cannot change through configuration.
Generic Thresholds
Generic thresholds let you dynamically set thresholds on any registered metric of type counter, histogram, or timer.
Configuring Monitoring Alarm Reports
You can configure the Logging Reporter and the Message Server Reporter to report monitoring alarms.
Logging Reporter
You can report alarms in the logging subsystem using the logging reporter. The logging subsystem is configured in the log section of Co-browse Server configuration.
All alarms that detect events are reported in log messages with level [ERROR] while all alarms that cancel events have level [WARN].
Detection alarms come in two types:
- fatal alarms with alarm log level
- standard alarms with standard log level
Cancellation alarms correspond to a trace log level.
Message Server Reporter
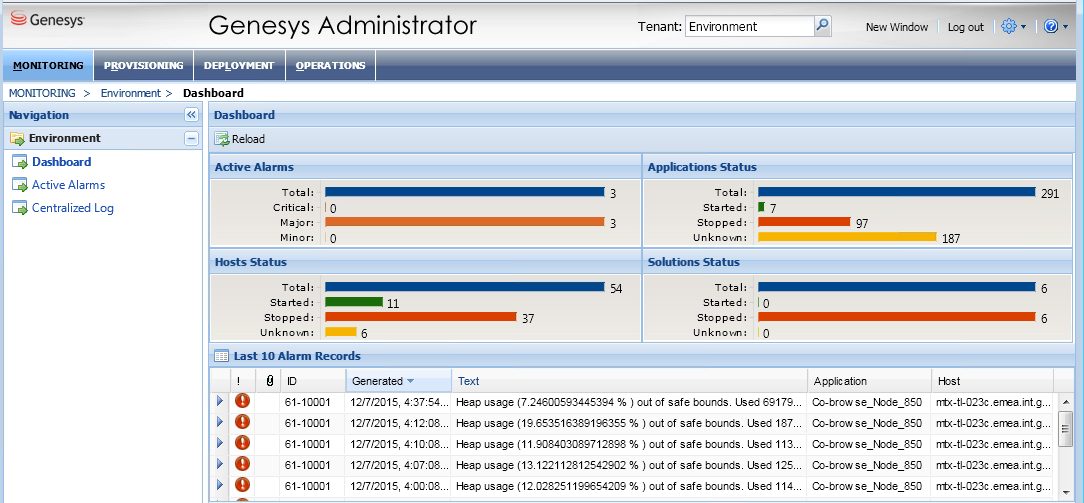
Starting with release 8.5.002, Co-browse Server supports a Message Server reporter you can use to display alarms in the Active Alarms section of Genesys Administrator. By reporting alarms in Active Alarms, you simplify application monitoring and avoid detailed logging that can affect system performance.
Configuring Monitoring Alarms
Alarms are log messages reported according to the configured log subsystem. To report a particular alarm in Active Alarms, you must configure:
- Message Server Reporter
- Alarm Condition object
- related threshold option in the server application
You can see the dependencies between Alarm Condition objects and related application server configuration options in the Common Monitoring Alarms Configuration Table.
Configuring Message Server Reporter
To configure Message Server reporter, specify the following:
-
Message Server Application:
In the messages section, set db_storage to true.
-
Co-browse Cluster Application:
- Add a connection to the Message Server application.
- Configure the metrics section:
- Set reporter.messageServer.enabled to true (default value).
- Set the reporter.messageServer.logFrequency. The default value is 30 minutes.
-
Co-browse Node application's log section:
Configuring Alarm Condition Object
Message Server reporter needs each predefined threshold to have a related Alarm Condition object in the Genesys Configuration.
While each predefined alarm can contain dedicated Alarm Condition object, only one Alarm Condition object is allowed for generic alerts because their Detect Log Event ID is the same.
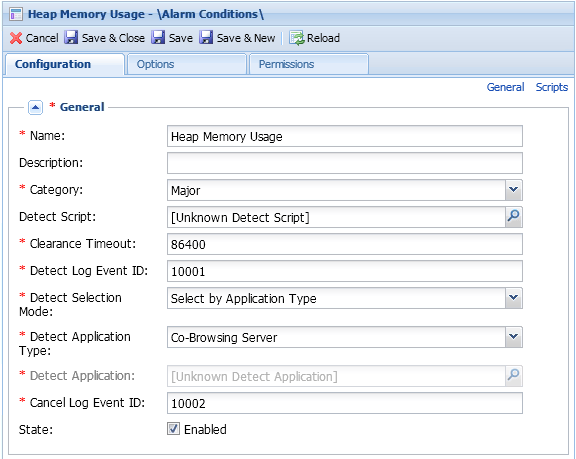
You must manually create Alarm Condition objects in the Alarm Conditions section of Genesys Administrator:
Configuring an Alarm Condition Object in Genesys Administrator
- Open the Provisioning > Environment > Alarm Conditions section in Genesys Administrator.
- Click New to create a new object.
- Specify a Name. The value can be any string.
- Set the proper Detect Log Event ID and CancelLog Event ID, see the Co-browse alarms configuration table.
- Set Select by Application Type to Detect Selection Mode.
- Set Co-Browsing Server for Detect Application Type.
- Save your changes.
Configuring the threshold option in the server configuration
Co-browse server configuration contains the following common predefined threshold options:
- HeapMemoryUsage.threshold
- GcFrequency.threshold
- GcLatency.threshold
- InactiveSessions.threshold
- JettyThreadPoolUsage.threshold
- ServerResponseTime.threshold
- SlaveRenderLatency.threshold
- Generic threshold configurations use the option <metricName>.threshold.
To configure a predefined threshold set the proper value for the corresponding option.
To configure a generic threshold:
- Substitute the metric name placeholder with the actual metric name, see Breakdown of Available Metrics.
- Set the proper value for the metric's threshold.
Co-browse Alarms Configuration Table
|
Alarm name |
Alarm Condition object | Related configuration option, metrics section | ||||||
|---|---|---|---|---|---|---|---|---|
|
Threshold type |
Selection mode | Application type |
Detect Event ID |
Cancel Event ID |
Option | Default value |
Description | |
| Heap Memory Usage | predefined | Select by Application Type | Co-browse Server | 10001 | 10002 |
HeapMemoryUsage.threshold |
0.8 | Defines heap memory usage threshold value. This is the ratio of the used heap memory to the maximum heap memory. |
| GC Frequency | 10003 | 10004 |
GcFrequency.threshold |
24 | Defines GC frequency threshold value for an hour. | |||
| GC Latency | 10005 | 10006 |
GcLatency.threshold |
1000 | Defines GC Latency threshold value, in milliseconds, in relation to the last GC occurred in the configured time interval. | |||
| Inactive Sessions | 100001 | 100002 |
InactiveSessions.threshold |
0.2 | Defines the ratio of inactive sessions to all sessions from the configured time interval. It shows how many Co-browse sessions were created by master but never joined by an agent. | |||
| Slave Render Latency | 100003 | 100004 |
SlaveRenderLatency.threshold |
10000 | Defines, in milliseconds, the SlaveRenderLatency metric threshold value in the configured time interval. Slave rendering latency shows whether reported slave rendering is too slow. | |||
| Jetty Thread Pool Usage | 100005 | 100006 |
JettyThreadPoolUsage.threshold |
0.9 | Defines Jetty thread pool usage threshold value. This is the ratio of the used Jetty thread pool size to the maximum available. It signals whether too few free threads handle http requests. | |||
| Server Response Time | 100007 | 100008 |
ServerResponseTime.threshold |
100 | Defines, in milliseconds, the maximum value allowed for ServerResponseTime metric. The metric is calculated as average time for the latest N routings of data from master to agent, where N is defined by the ServerResponseTime.slidingWindowSize option value. | |||
| ServerResponseTime.slidingWindowSize | 1000 | Defines the number of recent measurements applied for the ServerResponseTime metric calculation. | ||||||
| Generic alarm | generic | 10007 |
Generic threshold option |
Defines threshold value for the particular metric. | ||||
Using Alarms to Improve Performance
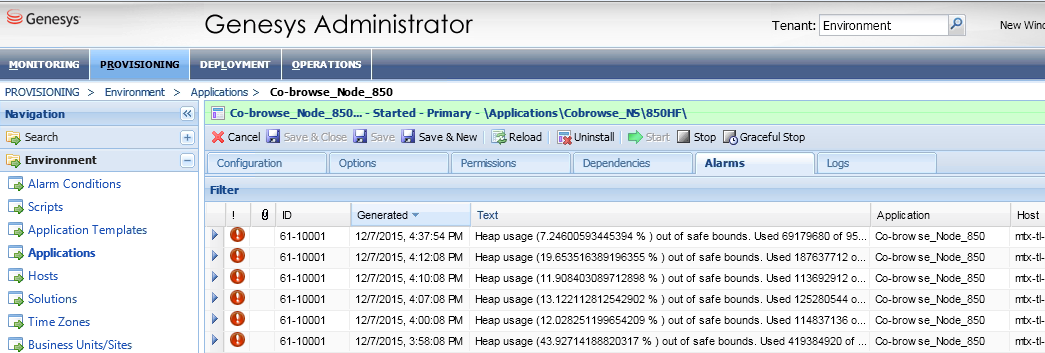
Monitoring Alarm Reports
Once you complete your project's Alarm Reporting Configuration, you can monitor the application server:
Taking Action to Address a Monitoring Alarm
Monitoring alarms detect problems in your application server. Use the table below for possible actions to resolve problems detected.
Once you fix a problem, the application server recalculates the metric after the monitoring time interval and deletes the alarm from the alarm monitoring view. At the same time, the appropriate message appears in the log and states that the metric value is back to normal.
Actions to Respond to Common Alarms
| Alarm name | Fatal? | Detect alarm message example | Problem description | Actions to fix the problem | Cancel alarm message |
|---|---|---|---|---|---|
| Heap Memory Usage | yes |
[ERROR] HeapUsageThreshold - Heap usage (40.65 % ) out of safe bounds. Used 388140568 of 954728448 bytes. |
This alarm signals that application server is working but at full capacity. |
To prevent the application from overloading, you should extent the memory heap:
|
[ INFO] HeapUsageThreshold - Heap usage (30.05 %) is back to normal |
| GC Frequency | no |
[ERROR] GcFrequencyThreshold - Garbage collection frequency (24,4718 per hour) is out of bounds (24,000000 per hour). |
There might be several causes:
|
If above solutions did not help, you should add key Xmn* in the JAVA_OPTS directive in setenv.bat/sh file. |
[ INFO] GcFrequencyThreshold - Garbage collection frequency (20.6773 per hour) is back to normal |
| GC Latency | no | [ERROR] GcLatencyThreshold - Garbage collection latency (<number> milliseconds) is out of the defined bounds (<number> milliseconds). | This alarm means that GC processor is overloaded. |
To resolve the problem, you should remove excessive load by either:
|
[ INFO] GcLatencyThreshold - Garbage collection latency (251 milliseconds) is back to normal |
Localizing Monitoring Alarms
You can localize alarm log messages using an LMS file. You can have two type of LMS files, one LMS file that includes common log messages and a project specific LMS file. Default LMS files are embedded into the application server code.
To change the log message text, use the custom LMS files shipped with the product. The custom LMS files are in the launcher directory, one common LMS file name GeneralAlarms_en.mls and one project specific LMS file.
To add loclization to your monitoring alamrs, apply the following to each custom LMS file:
- Copy the content of the file to a new file name which ends with a system locale abbreviation. For example, au for Australia and fr for France. The common LMS file name for Australia would be GeneralAlarms_au.lms.
- Edit the new file to change the log message text. Save your changes.
- After you have finished editing each custom LMS file, restart the application server.


