Contents
Customize Journey Dashboard for Pulse
Pulse widgets for Context Services are not editable from the Pulse Template Management UI. To customize widgets for Context Services, you must edit and submit the templates through the Pulse REST API.
Prerequisites
| Component | Version |
|---|---|
| GMS | 8.5.106+ |
| Pulse | 8.5.102.xx or 8.5.105.01
Important Versions 8.5.103 and 8.5.104 are not supported. |
| GAX | 8.5.102.18 |
Set Pulse Permissions
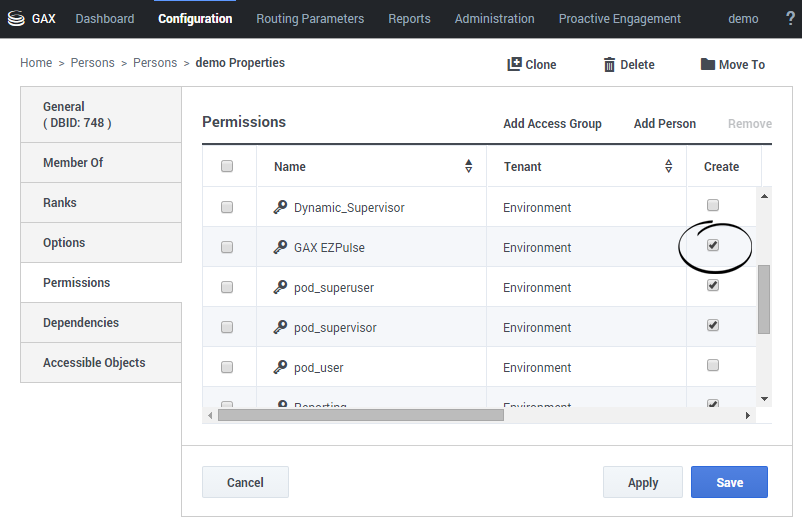
Open GAX or Genesys Administrator and navigate to Configuration > Persons. Select your user and edit his or her permissions to add the GAX EZPulse permissions, then Save.
Create Journey Pulse Widgets
Add journey sample layouts to Pulse
Context Services Pulse layout samples are available in the following directory:
- <GMS installation directory>/Pulse_8.5.102 for integration with Pulse 8.5.102 versions.
- <GMS installation directory>/Pulse_8.5.103 for integration with Pulse 8.5.105.01.
To deploy these samples in Pulse, you can use the Genesys Pulse Restful Web Service API.
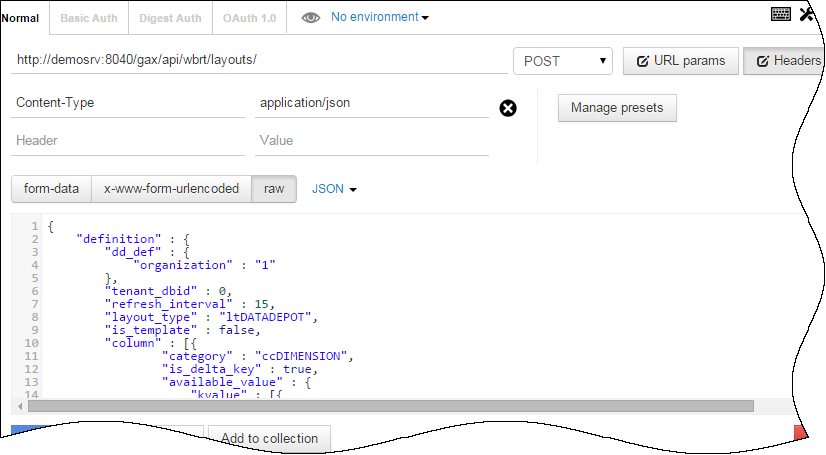
Start a Restful client application (Postman in our example). Submit a POST or PUT API query to GAX to publish the layout sample.
- For Pulse 8.5.102 versions:
- POST /api/wbrt/layouts/ to deploy a new layout.
- PUT /api/wbrt/layouts/<id> to update an existing layout.
- For Pulse 8.5.105.01:
- POST /api/wbrt/templates/ to deploy a new layout.
- PUT /api/wbrt/templates/<guid> to update an existing layout.
Add your widgets
For Pulse 8.5.102 versions
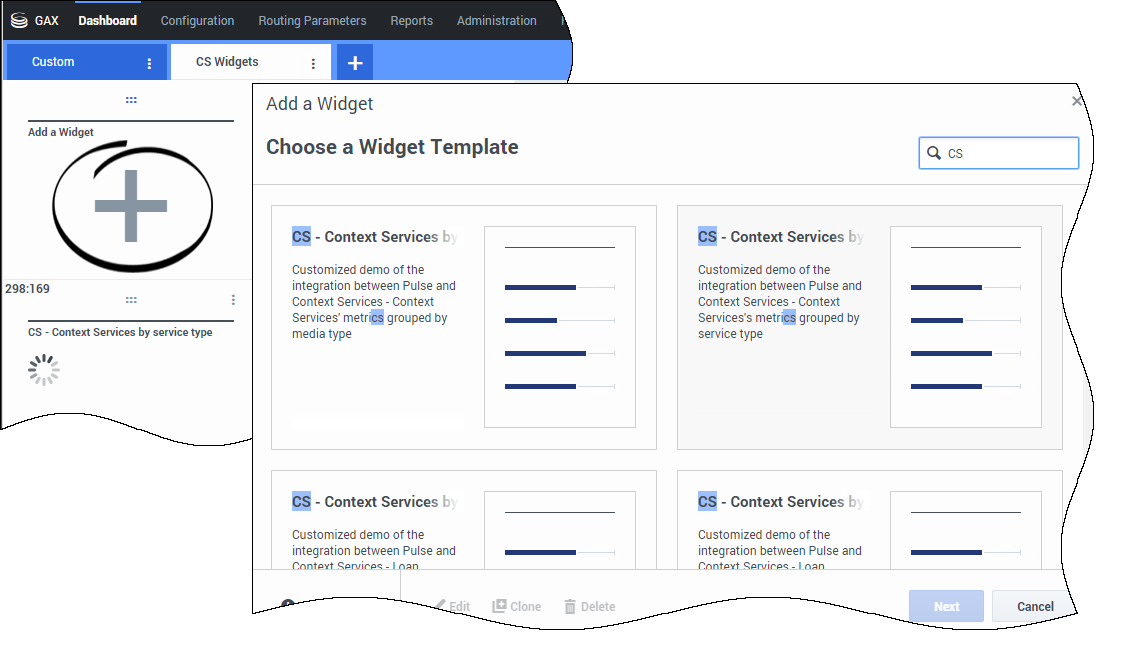
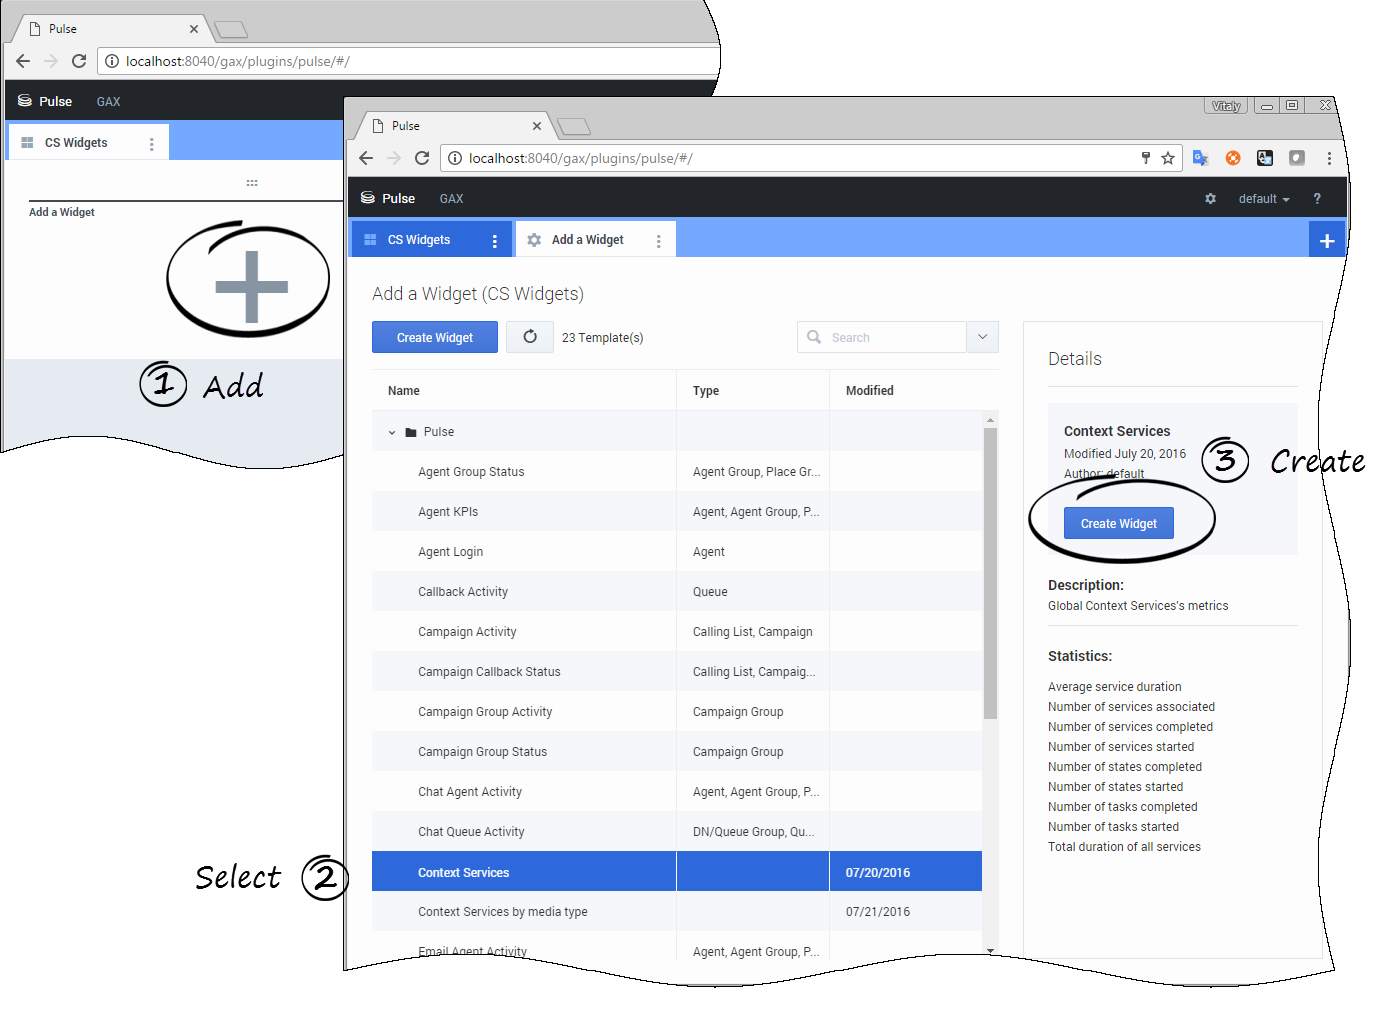
Once the templates are published in Pulse, it's very easy. Just navigate to your Pulse Dashboard. The new layouts will be available in the creation wizard.
For Pulse 8.5.105.01 version
Once the templates are published in Pulse, it's very easy. Just navigate to your Pulse Dashboard. The new layouts will be available in the creation wizard.
Edit Pulse External Templates
Retrieve your layout for Pulse 8.5.102
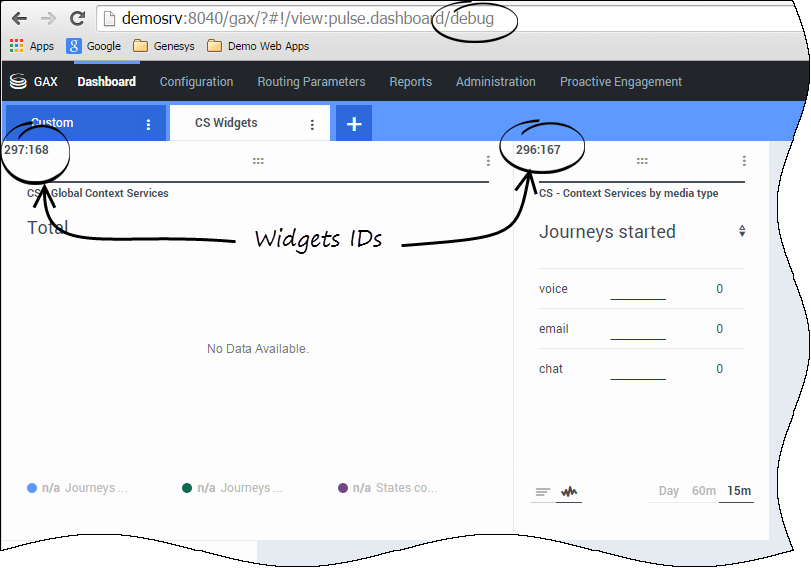
Open Pulse in Genesys Administrator extensions and navigate to your Context Services widget. Append /debug at the end of your URL. The widget and layout IDs will show up in the left corner of each widget.
In our example, 297:168 means that the widget ID is 297 and the layout ID is 168.
Get the layout definition of your widget
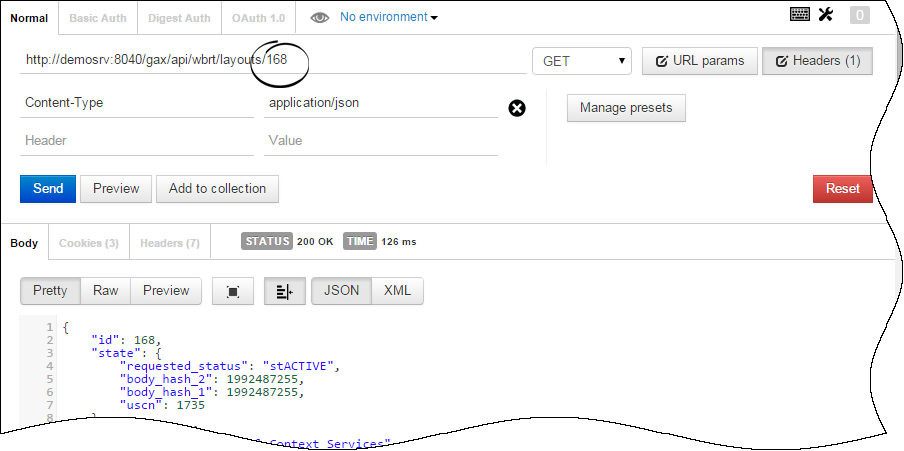
Start a Restful client application (Postman in our example). Submit a GET API query to GAX to retrieve the layout associated to your widget ID:
GET http://<host>:<port>/gax/api/wbrt/layouts/<layoutID> URL with the header set to Content-Type= application/json
See the Genesys Pulse Restful Web Service API for further details.
Retrieve your layout for Pulse 8.5.105.01
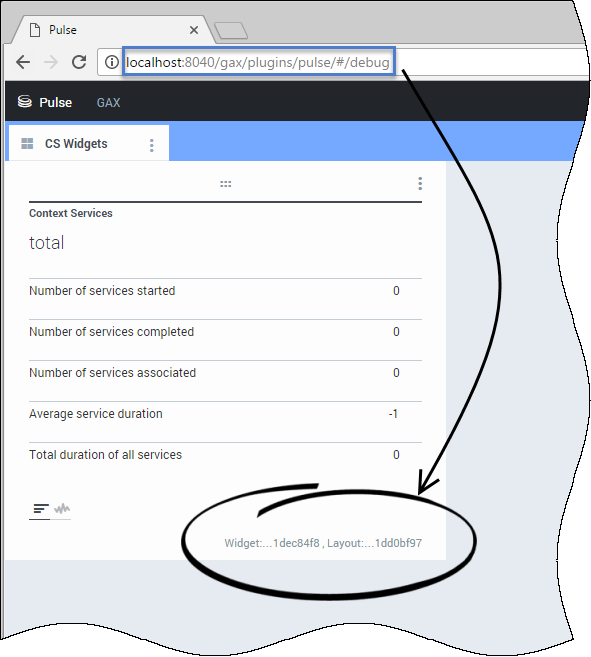
Open Pulse in Genesys Administrator extensions and navigate to your Context Services widget. Append /debug at the end of your URL and press Enter.
- The URL is restored to its previous state (without /debug).
- The widget and layout GUIDs will show up as a clickable link available in the right bottom corner of each widget.
Click the link to display the layout in a separate tab.
Edit and publish the layout
To learn how you can modify the layout, read the detailed section below. Then, deploy or update your layout.
How to modify the JSON Layout
Each Pulse template has a unique ID, a definition, and a state property. If you wish to modify the template, do not modify the template ID; else, if you modify this ID, you will create a new template.
{
    "id": <id>,
    "state" : { /** specific state information - do not modify **/
    "definition": {
        /*... See Definition section */
    },
   "generator_info": { /** specific generated information - do not modify **/
   }
}Definition property
In the Definition parameter of the JSON layout, you will find the following parameters.
| Field | Description |
|---|---|
| name | Defines the template name displayed to the User in the Add a Widget interface of Pulse. |
| description | Defines the template description displayed to the User in the Add a Widget interface of Pulse.
"Customized demo of the integration between Pulse and Context Services - Context Services's metrics grouped by service type" |
| layout_type | Defines the source of the layout type. Do not modify this type; it must be set to ltDATADEPOT. DataDepot is an internal collector that Context Services uses to communicate with Pulse. |
| refresh_interval | Defines the refresh interval of the template in seconds. For instance, 60. |
| columns | Defines the content of the objects and statistics available in the template. See the columns property table below for further details. |
Columns property
The following table details the JSON layout columns properties of the definition attribute.
| Field | Description |
|---|---|
| id | Defines the technical alias of the objects or statistics IDs defined in the template_columns property.
For instance, "id": "_Object$ID" or "id": "service_started" |
| category | Category of the column that can be a dimension if set to ccDIMENSION, or a statistic if set to ccMEASURE. |
| format | Format of this column that can be one of the following values: string, percent, integer, time |
| available_value | Objects available in the template.
"available_value": {
 "type": "stKEYVAL",
    "kvalue": [
          {   "v": "Loan Selection",
               "k": "4460"},
         {  "v": "Credit Card Selection",
                "k": "4478"}
     ]
} |
| selected_value | Objects selected in the template.
"selected_value": {
    "type": "stKEYVAL",
    "kvalue": [
          {   "v": "Loan Selection",
               "k": "4460"},
         {  "v": "Credit Card Selection",
                "k": "4478"}
     ]
} |
Template_column property
For Pulse 8.5.102 versions
The template_column property contains an array of column templates. Each column template defines a statistic to calculate and will be displayed in the Statistics panel of the widget creation wizard.
"template_column": [
            {
                "id": "service_started",
                "type": "ctDATADEPOT",
                "format": "integer",
                "category": "ccMEASURE",
                "label": "started",
                "vt": "vINT",
                "dd_column": {
                    "group_name": "cs.service",
                    "expr": "#a = #dd_stat(#dd, #organization, #group_name, #aggregate_name, {#criteria_name, #selected}, #rollup_range, #calculation_type)",
                    "aggregate_name": "service.started",
                    "rollup_range": "DAY",
                    "calculation_type": "COUNT",
                    "criteria_name": "service_type"
                }
            },
            { /** Other statistics **/
                }
   ],
For Pulse 8.5.105.01 version
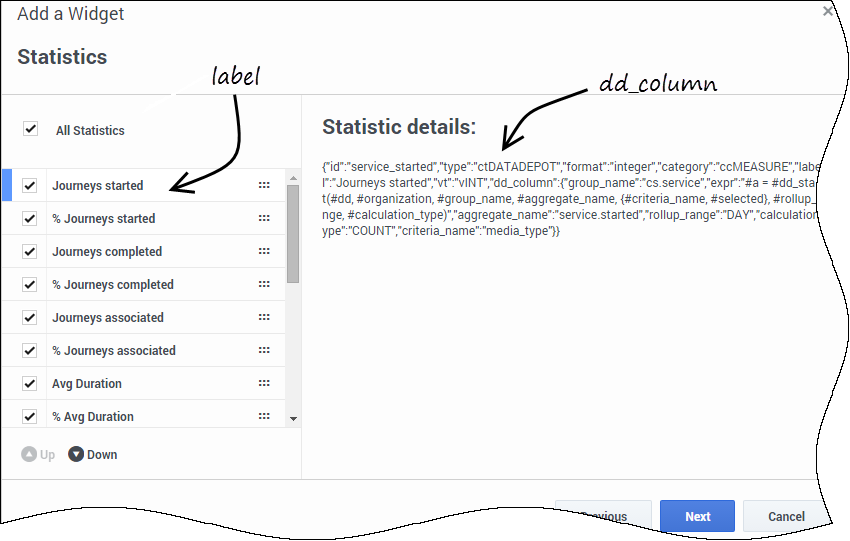
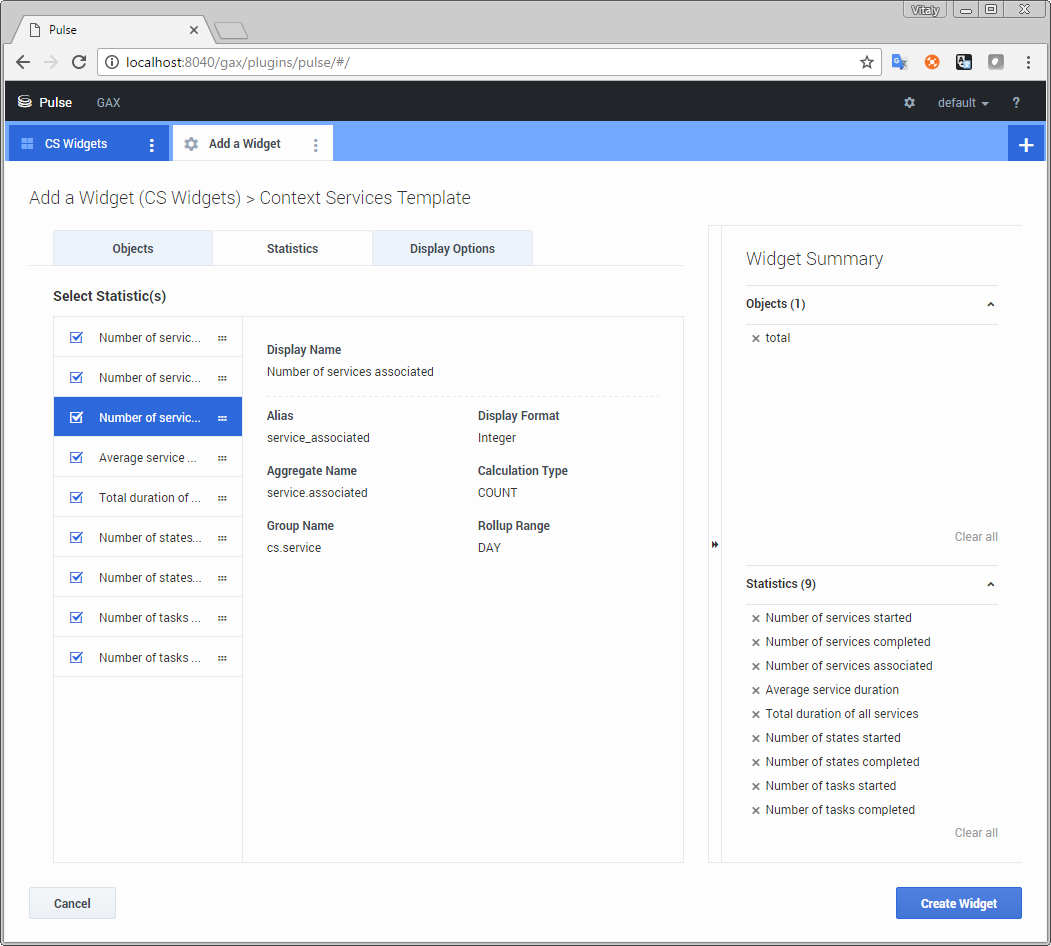
The template_column property contains an array of column templates. For each dd_column, Pulse displays details on how this column is calculated: type of calculation, roll-up period, aggregate, group names, and more.
Create dd_column objects
Each dd_column object is a JSON Object that defines the statistics data and calculations. The statistics is calculated within the expr mandatory property that is a Spring expression. See the official documentation here.
This expression calls a custom extension function dd_stat to retrieve Statistics and assigns the result to a variable named "a". The expression uses the other properties defined in the dd_column structure to calculate the statistics.
| Property Name | Possible Values | Definition |
|---|---|---|
| expr | Spring Expression Language (SpEL). | Defines a statistic using the above values to create a Spring expression. The expression uses the properties defined in the dd_column structure:
|
| group_name | cs.service | Group to use for Context Services. |
| aggregate_name |
|
Events used for the statistics. |
| criteria_name |
|
Not mandatory. |
| calculation_type | COUNT | Counts events. |
| SUM
MIN MAX AVG |
Used for duration statistics (service.duration<SUM,AVG,MIN,MAX>). | |
| rollup_range |
|
Timeframe for the statistic. |
The dd_column example above retrieves a simple value, but it could report a percentage value. For example, you can report a percentage of services started for one media type compared to all of the started services or media types.
#a = #dd_stat(#dd, #organization, #group_name, #aggregate_name, {#criteria_name, #selected}, #rollup_range, #calculation_type);
#b = #dd_stat(#dd, #organization, #group_name, #aggregate_name, {}, #rollup_range, #calculation_type);
#a = T(java.lang.Double).parseDouble(#a);
#b = T(java.lang.Double).parseDouble(#b);
(#b == 0) ? 0 : #a*100/#b
The code above queries two Data Depot metrics, converts each value from String to double , then calculates the required percentage value. As you may have noticed, both expressions used the #selected variable.
Metrics across multiple groups
The Pulse layout definition allows you to query for the same metrics across multiple groups (for example, media types). To do so, you can define a list of all possible values in the structure called available_value. During the widget configuration, the Pulse user will select the available values to display on the dashboard.
The values that the user selects are saved as a subset of the available values in the selected_value structure and later iterated to provide the result.
"available_value" : {
  "kvalue" : [{
    "v" : "media type 1",
    "k" : "1"
  }, {
    "v" : "media type 2",
    "k" : "2"
  }, {
    "v" : "media type 3",
    "k" : "3"
  }],
  "type" : "stKEYVAL"
},
"selected_value" : {
  "kvalue" : [{
    "v" : "media type 1",
    "k" : "1"
  }, {
    "v" : "media type 2",
    "k" : "2"
  }],
 "type" : "stKEYVAL"
}
