Contents
Engagement Summary Today Extended View
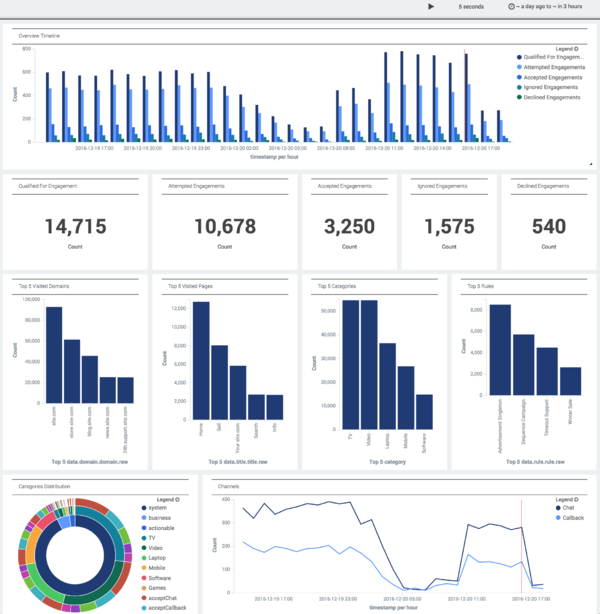
If you expand the Engagement Summary in the Basic View, you see a dashboard like this:
You can choose which of these elements to display, and you can filter your data, as mentioned on the Extended Views page.
Overview Timeline
The Overview Timeline uses a grouped bar chart to display historical engagement information, with each group calculated on an hourly basis.
The information in this chart is derived from all events that have occurred within the time frame established by the time filter, which is set to Today by default. The metrics used in this chart are explained in the next section.
Overview Timeline - KPI Widget Set
This set of KPI widgets shows a summary of important engagement statistics from within the time frame established by the time filter. These statistics are used in the Overview Timeline described in the previous section.
Note: These statistics are different from the ones displayed in the GWE - Engagement Summary Today basic view.
KPI Metrics
- Qualified For Engagement—Total number of visits that have triggered a HotleadIdentifiedActionableEvent event from one of the rules set up for Web Engagement
- Attempted Engagements—Total number of visits that have led to an engagement offer (Disposition event)
- Accepted Engagements—Total number of visits for which an engagement offer was accepted
- Ignored Engagements—Total number of visits for which an engagement offer was ignored
- Declined Engagements—Total number of visits for which an engagement offer was declined
Note: A single visit may include more than one engagement attempt. For example, a banner ad could be followed by an offer to chat.
Category Distribution
The Engagement Summary Today extended view includes a widget that can be extremely useful when you need to understand how a category leads to a certain result. This widget displays a sunburst of distributed categories within three layers:
- Event Type (the inner ring)
- Category Name (the center ring)
- Result (the outer ring)
These layers represent hierarchical data, starting from the innermost ring, and working outwards. As you work your way out, through the rings of the chart, the data that is adjacent to any given segment of an inner ring forms a subset of its data, as you can see if you take a close look at this example:
Although sunbursts aren't intuitive to everyone, this one might be the best way to present the information you need.
Top 5 Widget Set
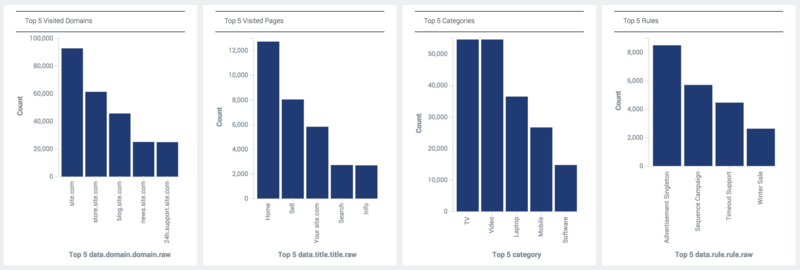
The widgets in this set show the number of hits for the Top 5:
- Domains visited by customers during their journey
- Pages they visited during their journey
- Categories set up on the pages they visited
- Rules they triggered
These values are all based on the time frame established by the time filter.
Channels
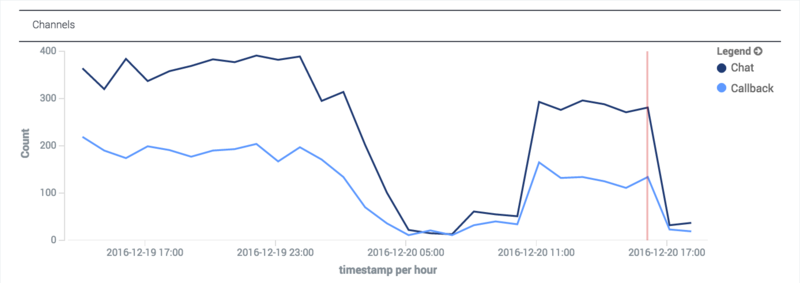
This widget shows trend data for chat and web callback engagements accepted within the given time frame.


