Elasticsearch Connector
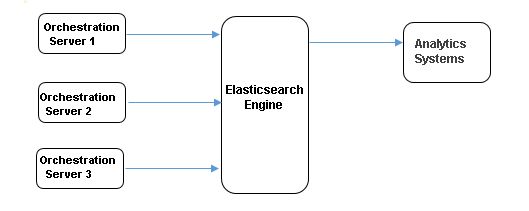
Starting with Release 8.1.400.40, Orchestration Server uses
Elasticsearch 2.x to store data, such as operational and performance data. The data may then be used with Kibana (default) or a custom visualization tool to monitor Orchestration Server performance and routing session processing in near real time.

Starting with release 8.1.400.64, ORS supports Elasticsearch releases 5.x, starting from 5.3.0.
There have been significant changes between major Elasticsearch releases, in relation to APIs and settings. ORS functionality has been enhanced such that it dynamically adjusts in accordance with the version of the Elasticsearch node that it operates with.
Important
Secure connections to Elasticsearch 5.x are supported using TLS 1.2 only.
General Setup/Configuration
- Download and install
Elasticsearch.
- Configure Elasticsearch for Orchestration.
- Configure the ORS Elasticsearch options for session, performance, and node reporting. You do not have to configure each type of reporting (although you can); you can configure only the reporting options that you wish to use.
- Configure Security options.
Configuring Elasticsearch for Orchestration
[+] Configuring Elasticsearch for Orchestration
The purpose of the information below is to provide basic recommendations for Elasticsearch 2.2+ configuration that will be more or less optimal in an Orchestration-specific scenario. It is not a complete Elasticsearch configuration guide of any kind. To get complete information about Elasticsearch installation, go to www.elastic.co.
Note: The URLs shown below were obtained from the Elasticsearch website on 03/31/16.
Specifics of Orchestration Usage of Elasticsearch
The Orchestration scenario is very similar to a “Logstash” scenario – very frequent index writes and not very frequent queries. Orchestration uses two daily indexes, “session-*” and “performance-*”, that experience frequent write operations, mostly via the bulk API of Elasticsearch. To ensure that Elasticsearch will successfully handle data from Orchestration, some important adjustments of the default configuration of Elasticsearch data nodes are required.
Elasticsearch Clustering
Generally speaking, in most cases, even a single properly configured Elasticsearch data node may handle the load produced by an Orchestration cluster in deployments with 5-10 sessions per second. However, we suggest provisioning of an Elasticsearch cluster with at least two data nodes and one load-balancing (client) node.
Suggested Configuration for Elasticsearch Data Nodes
JVM Heap Size
The recommended size of JVM heap is at least 6GB. For detailed instructions for setting on a particular platform, look in https://www.elastic.co/guide/en/elasticsearch/guide/current/heap-sizing.html
Disable Memory Swapping
In the elasticsearch.yml file:
- bootstrap.mlockall: true (before ES version 2.4)
- bootstrap.memory_lock: true (starting from ES version 2.4)
For details, look in
https://www.elastic.co/guide/en/elasticsearch/reference/2.2/setup-configuration.html#setup-configuration-memory
Transaction Logging Configuration
In the elasticsearch.yml file:
- index.translog.durability: async
- index.translog.flush_threshold_ops: 5000
The first setting is the most important one – it enforces Elasticsearch to fsync and commit a transaction log in the background every 5 seconds (default value of index.translog.sync_interval), instead of doing that after each operation (default setting). For details, look in
https://www.elastic.co/guide/en/elasticsearch/reference/2.2/index-modules-translog.html#_translog_settings
Thread Pool Configuration
In elasticsearch.yml file:
- threadpool.bulk.size: # availableProcessors
- threadpool.bulk.queue_size: 500
- threadpool.index.size: # availableProcessors
- threadpool.index.queue_size: 500
In most cases, explicit configuration of the “size” parameter is not required because Elasticsearch will detect the number of processors and use it "under the hood." However, sometimes that number is not properly retrieved, so it is better to configure it by hand. The number of processors, detected by Elasticsearch, may be checked via “_nodes/os” API. For details of thread pool configuration, check
https://www.elastic.co/guide/en/elasticsearch/reference/2.2/modules-threadpool.html
Indices Settings
In the elasticsearch.yml file:
- indices.memory.index_buffer_size: 30%
- indices.memory.min_shard_index_buffer_size: 12mb
- indices.memory.min_index_buffer_size: 96mb
The purpose of these settings is to slightly increase the size of JVM heap used to buffer newly indexed documents.
For details, look in https://www.elastic.co/guide/en/elasticsearch/reference/2.2/indexing-buffer.html
Cache Sizes
In the elasticsearch.yml file:
- indices.fielddata.cache.size: 15%
Defines the % of node VM heap that is used as a field data cache. For details, check
https://www.elastic.co/guide/en/elasticsearch/reference/2.2/modules-fielddata.html
Index Refresh Interval
In the elasticsearch.yml file:
- index.refresh_interval: 5s
This is the time between index refreshes, when newly created documents become available for search operations. Since refresh is somewhat expensive, it is better to increase it from the default 1s. For details, check
https://www.elastic.co/guide/en/elasticsearch/reference/2.2/index-modules.html#dynamic-index-settings
Inline Indices Support
Support of scripting for “update” API has to be enabled.
In the elasticsearch.yml file:
- es.script.engine.groovy.indexed.update=true # (for ES 2.x)
Final Note
From the suggested Elasticsearch configuration changes, only three are mandatory:
- Increased JVM heap size
- Disabled swapping (bootstrap.mlockall: true or bootstrap.memory_lock: true)
- Asynchronous translog commit (index.translog.durability: async)
For all other configuration parameters, we suggest to monitor real resource utilization by Elasticsearch nodes (via _nodes/stats API) and use Elastisearch recommendations and your own good judgment. The best source of information is “ElasticSearch: The Definitive Guide” https://www.elastic.co/guide/en/elasticsearch/guide/current/index.html
Elasticsearch 5.3 Configuration Recommendations
The following options must be configured in the elasticsearch.yml file if Elasticsearch 5.3 is being used:
- bootstrap.memory_lock: true
- indices.memory.index_buffer_size: 30%
- script.engine.painless.stored.update: true
Configuring ORS Options for Elasticsearch
Session Reporting
ORS stores SCXML session data into Elasticsearch where documents are created in a “session” daily index. The Orchestration session ID is used as index key. ORS saves information about session states if
_es_store=true in the state description in the strategy. Example: <state id="routing" _es_store=”true”>.
[+] Session Reporting Document
Note: This document is predefined and not configurable.
ORS stores following session data:

“ani”: ”<The value of the ANI attribute. It applies to voice interactions only>”,
“application”:”<URL of the SCXML document>”,
“begin”:”<date and time in UTC format when that session has been started>”,
“cluster”: “<name of ORS cluster>”,
“connectionID”:”<ConnID for primary voice call, empty otherwise>”,
“device”:”<for voice, name of DN where call arrival initiated session creation, for multimedia, name of queue that interaction was pulled from>”,
“end”:”<date and time in UTC format session has been terminated>”,
“interactionID”:”<interaction ID>”,
“media”:”<name of media type>”
“node”: “<name of ORS node>”,
“states”:
   “<state name>”:
   “total_duration”:<sum of durations in that state, msec>,
   “count”:<number of times scxml entered that state>
 “duration”: ”<The duration of the session in seconds (the difference between end and begin timestamps). It is populated at session termination>”,
Notes:
- If "<state name>" contains dot symbols (.), the state name stored in Elasticsearch will contain underscore symbols instead of dots.
- Starting with release 8.1.400.43, ORS stores two new Session Reporting fields into Elasticsearch: ani and duration.
Session reporting uses the following options:
ors-es-session-report
Option section: elasticsearch
Configuration object: ORS Application object
Default value: false
Valid values: true, false
Value changes: Take effect immediately upon notification.
This option specifies if session reporting is enabled or disabled. When set to true, session reporting is enabled. When set to false, session reporting is disabled.
If an ors-es-session-report value is changed from false to true in the middle of a session, ORS will send an update request for a non-existing session document. Elasticsearch will respond with a "document missing" exception, which ORS will ignore.
ors-es-bulk-write-period
Option section: elasticsearch
Configuration object: ORS Application object
Default value: 5 seconds
Valid values: An Integer value in the range of 5 to 120 seconds.
Value changes: Take effect immediately upon notification.
Used for both session and performance reporting. The word "bulk" refers to the possibility of having ORS accumulate a configurable amount reporting data and then sending the data to Elasticsearch instead of sending one reporting request at a time.
This option specifies the maximum time interval between the sending of two bulk requests to Elasticsearch. The bulk mechanism is based on an internal buffer that stores all requests that should be sent to Elasticsearch. In cases where there are no buffered requests, the actual time between two bulk requests could exceed the ors-es-bulk-write-period. However, when there is a steady stream of the requests to be handled by single bulk operation, the actual time between two bulk requests will be equal to the time defined by this option.
ors-es-bulk-max-size
Option section: elasticsearch
Configuration object: ORS Application object
Default value: 10000
Valid values: Integer value in range from 1000 to 10000000
Value changes: Take effect immediately upon notification.
Used for both session and performance reporting. This option specifies the maximum number of actions inside a single bulk request. If reporting is enabled, ORS stores all requests in its internal bulk requests cache. This option can be set to control cache overgrowth. If the maximum number of actions in the cache is reached, ORS removes the oldest actions and inserts the newest.
Note: Genesys recommends clustering Elasticsearch nodes with several master nodes to prevent a potential loss of reporting data should an extended node disconnect occur (unless all available Master nodes in an Elasticsearch cluster are excluded).
Performance Reporting
If performance monitoring is enabled, ORS stores performance data into Elasticsearch where documents are created in a “performance” daily index.
[+] Performance Reporting Document
Note: This document is predefined and not configurable.
ORS stores following session data performance data:
“cluster”: “<name of ORS cluster>”,
      “node”: “<name of ORS node>”,
      “timestamp”:”< date and time in UTC format when that performance counter has been submitted by ORS>”,
“counters”:{
    “name”: “<counter name>”:<counter value>}
Performance reporting uses the following options:
ors-es-perfsnapshot-report
Option section: elasticsearch
Configuration object: ORS Application object
Default value: false
Valid values: true, false
Value changes: Take effect immediately upon notification.
This option specifies if performance reporting is enabled via Elasticsearch.
- If set to true, performance reporting via the Elasticsearch is enabled.
- If set to false), performance reporting via Elasticsearch is disabled.
ors-es-bulk-write-period
Used for both session and performance reporting. Option ors-es-bulk-write-period allows you to submit session or performance reporting to Elasticsearch via a "bulk" mode. For information on this option, see the description in Session Reporting.
Node Reporting
ORS stores node information into Elasticsearch where a document is created in a “nodes” index. The document is created during node startup and updated when ORS switches to primary mode.
[+] Node Reporting Document
Note: This document is predefined and not configurable.
ORS stores the following node data:
      “cluster”: “<name of ORS cluster>”,
“default_port”: <ORS default port>,
      “host”:  “<hostname where application is running>”,
“http_port”: <ORS http port>,
      “node”: “<name of ORS node>”,
“synch_port”: <ORS synch port>,
      “application”: “<name of application that currently is in primary mode>”,
      “sw_start”: “<date and time in UTC format  when ORS switches to primary mode>”
If the port is not configured in the Application, then ORS reports the value -1.
Node reporting uses the following options:
ors-es-node-info-report
Option section: elasticsearch
Configuration object: ORS Application object
Default value: false
Valid values: true, false
Value changes: Take effect immediately upon notification.
This option specifies if node reporting via the Elasticsearch engine is enabled.
If, upon ORS startup, ors-es-node-info-report has a value of false, and the value is subsequently changed to true, the report information will not be sent.
ors-es-nodes
Option section: elasticsearch
Configuration object: ORS Application object
Default value: <empty string>
Valid values: String containing a semicolon-separated list of http(s)://host:port of ElasticSearch servers.
Value changes: Take effect after restart.
This option is used for connectivity to Elasticsearch. It specifies the addresses of Elasticsearch nodes. Configure each ORS to work with an Elasticsearch node. For valid values:
- If the node is specified as http://<ES host>:<port>, then a non-encrypted connection will be used for communication with Elasticsearch.
- If the node is specified as https://<ES host>:<port>, then an encrypted connection will be used for communication with Elasticsearch.
Reporting for ORS Elasticsearch Clusters
ORS nodes can send report requests to either a single Elasticsearch node or to an Elasticsearch cluster. It does not matter whether Elasticsearch is installed in single mode or in cluster mode. ORS communicates with Elasticsearch using the host:port specified in option ors_es_nodes.
- If Elasticsearch is configured as a single node setup, then ORS sends report requests directly to this node.
- In the case of an Elasticsearch cluster, each ORS Application can communicate with a specific node of the cluster, or all ORS Applications can communicate with a dedicated load-balancing node.
- The dedicated load-balancing node is the Elasticsearch node that is configured to receive documents and distribute them to the data nodes of the cluster.
- Upon startup, ORS connects to the first node in the ors-es-nodes list. If a disconnect from this Elasticsearch node occurs, ORS will try to connect to the next Elasticsearch node specified in the list.
ORS uses the following options for connectivity:
ors-es-reconnect-timeout
Option section: elasticsearch
Configuration object: ORS Application object
Default value: 5 seconds
Valid value: 1 to 20 seconds.
Valid changes: Take effect immediately upon notification.
This option specifies the timeout period that ORS uses when trying to reconnect to an Elasticsearch node. If a connection to Elasticsearch is lost, then ORS will try to reconnect to the next Elasticsearch node in the ors-es-nodes list.
ors-es-node-exclude-timeout
Option section: elasticsearch
Configuration object: ORS Application object
Default value: 600 seconds
Valid values: Integer value in range from 5 to 86400 seconds.
Valid changes: Take effect immediately upon notification.
After successfully connecting to an Elasticsearch node, ORS checks the node status. In case of a red status, ORS disconnects from the node and excludes the node from the reconnection procedure for the time period defined by the option ors-es-node-exclude-timeout.
Security Configuration
ORS communicates with Elastic search via the Elasticsearch REST API. The following security features are supported:
- TLS/SSL—ORS connects to Elasticsearch using SSL or TLS. The connection is supported via proprietary security layer in Genesys Framework libraries. For details, see the Genesys Security Deployment Guide, chapter "Protection of Data in Transit".
To enable a TLS/SSL connection to an Elasticsearch node, specify it in the ors-es-nodes option with the https:// prefix.
- Authentication (basic)—ORS supports authorization and authentication based on standard HTTP protocol mechanisms.
Configure the following basic authentication options:
username
Option section: elasticsearch
Configuration object: ORS Application object
Default value: <empty string>
Valid value: String value
Valid changes: Take effect immediately upon notification.
This option specifies the username that should be used for basic authentication on the Elasticsearch server.
password
Option section: elasticsearch
Configuration object: ORS Application object
Default value: <empty string>
Valid value: String value
Valid changes: Take effect immediately upon notification.
This option specifies the password that should be used for basic authentication on the Elasticsearch server.
Limitations
- All ORS Applications that belong to the same ORS cluster must be connected to master nodes of the same Elasticsearch cluster.
Configuring ORS Options for Elasticsearch 5.3
Users can configure the following options as required, if Elasticsearch 5.x is being used. All other existing options are supported for Elasticsearch 5.3 also.
Dynamic Index Settings
Starting from Elasticsearch 5.3, configuration of the index module for each Elasticsearch node in the elasticsearch.yml file is not possible. Settings for the index module can only be applied per-index via the Elasticsearch index or settings API. ORS uses the API to explicitly define the required index module settings for each index it creates.
The following option is available to configure the index module settings:
index-settings-<version>
Option section: elasticsearch
Default value: {"index":{"translog":{"durability":"async"},"refresh_interval":"5s"}}
Valid values: Elasticsearch API request content in the form of a JSON string.
Value changes: After ORS restarts.
This option is to define the Elasticsearch version-specific index settings based on which settings will be applied to the indexes that ORS creates. Each ORS application dynamically updates index settings after any operation that may cause the creation of a new index.
Important
Elasticsearch version in the above option can be specified completely, as in "5.4.0", or partially, as in "5" or "5.3". For example, if it is specified as "5", the index settings from this option’s value will be applied if the version of Elasticsearch starts with "5.".
Index Settings for Custom Indexes
A new attribute, settings, has been added to specify index settings for custom indexes created using the <elasticconnector:createdoc> or <elasticconnector:updatedoc> actions. If not specified, ORS uses the settings value specified in the index-settings-<version> option. If the Elasticsearch version is less than 5.x, this attribute is ignored.
If the <elasticconnector:createdoc> action or the <elasticconnector:updatedoc> action is executed without the settings attribute, the result is the same as executing the action with the value defined by the current Elasticsearch node's index-settings-<version> option.
Important
New index settings are sent for the custom index only if they are different from the previous settings sent for that particular index, except if the Elasticsearch node was disconnected or ORS was restarted.
Orchestration Plugin
Starting with Release 8.1.400.49, ORS installation includes a plugin for a real-time view of active sessions currently being executed. With the Orchestration Plug-in integrated into
Kibana you can:
- Display a list of active sessions.
- Use different filter criteria to refine the list of active sessions.
- View session-related information.
- Terminate an active session (for example, a "stuck" session).
You can filter using the following criteria:
- time interval (from/to)
- session age
- node (one or more)
- cluster, (one or more)
- device (routing point or interaction queue)
- media type (voice, email, chat, and so on)
ORS Application Configuration
In the ORS Application object, Options tab, configure the Elasticsearch options in the elasticsearch section as described above.
Plugin Installation
- Install Elasticsearch 2.4.1 and Kibana 4.5.0.
- Install ORS 8.1.400.49.
- Navigate to elasticserach\kibana-plugins\Orchestration subfolder and unpack the plugin.zip file.
- Follow the instructions provided in the installation guide PDF to launch Elasticsearch and Kibana.
[+] Plugin Installation Guide
Important
Starting with release 8.1.400.70, the Orchestration plugin is not compatible with versions of Kibana prior to 5.6.0.
PREREQUISITES:
Existing Kibana installation. This manual uses <Kibana root folder> instead of C:\bin\kibana for Windows and ~/<Kibana root folder> for Unix as the root path of your Kibana installation. This manual assumes that the current folder for the commands is the one where this document resides in the ORS package.
INSTALLATION STEPS:
1. Stop Kibana if it is running. Refer to the Kibana manual for the installed version.
2. Unpack the plugin.
On Windows:
- Open file plugin.zip in Windows Explorer.
- Click the “Extract all files” button and then follow the instructions on screen.
- Or use any archiving tool of your choice.
On Unix:
tar –xvzf plugin.tgz
3. Delete previous versions of the Orchestration plugin. Skip this step if this is the first installation of this plug-in. Note: you may need to have administrator privileges for this step.
On Windows:
- Open <Kibana root folder>\installedPlugins
- Delete the “orchestration” folder
- Open <Kibana root folder>\optimize\bundles
- Delete all files with names ending with .bundle.js, .entry.js, and .style.css
On Unix:
rm –rf ~/<Kibana root folder>/installedPlugins/orchestration
rm –rf ~/<Kibana root folder>/optimize/bundles/*.bundle.js
rm –rf ~/<Kibana root folder>/optimize/bundles/*.entry.js
rm –rf ~/<Kibana root folder>/optimize/bundles/*.style.css
4. Copy the plugin code to the Kibana plugin folder. Note: you may need to have administrator privileges for this step.
On Windows:
Copy the “orchestration” folder extracted on step 2 to the folder <Kibana root folder>\installedPlugins. If you have used Windows Explorer for unpacking, “orchestration” is under the “plugin” folder.
On Unix:
cp –R orchestration ~/<Kibana root folder>/installedPlugins/
5. Set the correct plugin version.
- Open the package.json file in the orchestration folder under the plugins folder of your Kibana installation folder, in any text editor.
- Look for the version field and change the value from the default 0.0.0 to the version of your Kibana installation.
- If unsure of your installation version, check the package.json file in the root folder of the Kibana installation.
6. Cleanup the Kibana index in ElasticSearch (if you ES instance was never connected to Kibana with the plugin (prior to version 8.1.400.63), skip this step).
- Edit the Powershell script reindex.ps1.
- If necessary, change the Kibana index name from the default .kibana to the one set in your installation.
- Check the Kibana configuration file if you are unsure of the index name.
- Run the edited script with parameters –h and –p specifying the host and port of your ElasticSearch instance. (Both parameters are optional. The defaults are localhost for –h and 9200 for –p. For example, powershell .\reindex.ps1 –h example.com –p 1234. Powershell version 3 or higher iss required.)
7. Start Kibana. Refer to the Kibana manual for the installed version. Starting takes a little time because Kibana has to process the plugin code.
CHECK THE INSTALLATION:
Open Kibana in a browser (yourdomain:5601 by default). When Kibana is loaded, an application switching button should appear to the right of Settings tab. When clicked, an application list will appear.
- Access the Kibana dashboard through your browser. Kibana adds an orchestration icon.

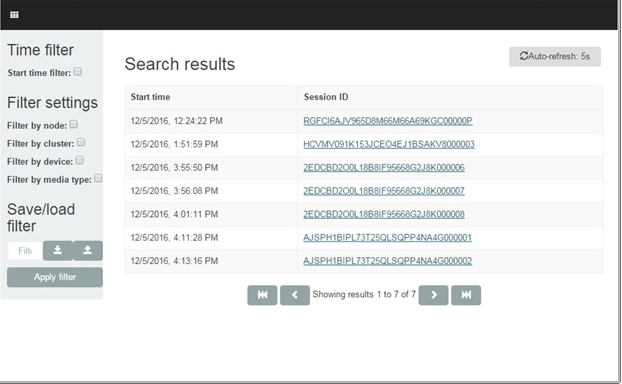
- Select the orchestration icon to bring up the plugin interface. The example below shows a list of active sessions.

- To the left, you can filter by session start time interval, session age, node, cluster, device or media type. You can also save and load filters.
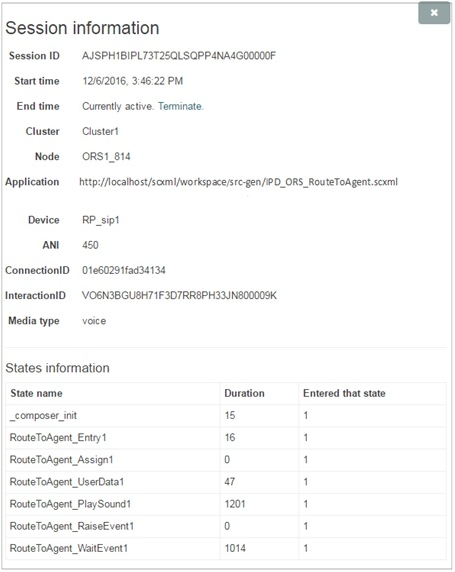
- To the right, the interface displays search results: the Start Time and Session ID of active sessions. Session ID is the link to the Session information dialog box (shown below), which contains a control to terminate a session.
- An Auto-refresh on/off button appears at the top right.
- Forward and back buttons appear for navigating through search results that exceed the page.
Applying a Filter
Below is an example of filtering for sessions within a specific time frame.
- Select the Start time filter check box.
- Define the from/to time frame using Start time interval button.
- Select the Apply filter button. Sessions filtered within this time frame display under the Session ID column.
Retrieving Session Information
Click particular session identifier. A Session information dialog box summarizes the selected session (see example below).
Terminating a Session
Click the Terminate link in the Session Information dialog box. An HTTP request to terminate the session is sent to the corresponding ORS node.

Plugin Limitations
The ability to terminate a session via the Orchestration Plugin feature is not supported:
- In a deployment using Recovery of Voice Calls Without Persistence.
- If an ORS node is restarted.
Elasticsearch Connector Enhancements
Starting with 8.1.400.58, ORS enhances its Elasticsearch real-time reporting capabilities with the addition of the following new features:
- Explicit mapping of session and performance indexes
- A new Orchestration SCXML extension, elasticconnector
- Samples of Kibana dashboards and visualizations
Explicit Mapping
ORS now uses
Explicit mapping instead of Dynamic mapping for session and performance indexes via the creation of index templates (tpl_session and tpl_performance). From a performance standpoint, Explicit mapping is more optimal and supports all data types. ORS creates Session and Reporting indexes as soon as it starts and switches to Primary mode.
New SCXML Extension
A new Orchestration SCXML extension, elasticconnector, provides simplified access to Elasticsearch APIs which allows communication with Elasticsearch without the usage of <session:fetch>. You can add new properties into a session document or create custom documents right from a strategy. To use elasticconnector actions, configure the corresponding namespace manually in Composer.
ORS supports the following new Action elements that can be used with Composer's SCXML State block:
[+] createindextemplate
Name
|
Required
|
Type
|
Def. value
|
Valid values
|
Description
|
requestid
|
False
|
Location expression
|
none
|
Any valid location expression, which represents a string.
|
This is the location for the request ID that is returned as
part of this request. Standard attribute of all
Orchestration actions.
|
name
|
True
|
Value expression
|
none
|
Any value expression that returns a valid string.
|
template name
|
index
|
True
|
Value expression
|
none
|
Any value expression that returns a valid string.
|
Elasticsearch index name (pattern).
|
order
|
False
|
Value expression
|
0
|
Any value expression that returns a valid integer.
|
Elasticsearch template order.
|
type
|
True
|
Value expression
|
none
|
Any value expression that returns a valid string.
|
Elasticsearch type name.
|
mapping
|
True
|
Value expression
|
none
|
Any valid ECMAScript object.
|
Object that represents the whole body of Elasticsearch property
of mappings.type in the mapping request.
|
timeout
|
False
|
Value expression
|
0
|
Any value expression that returns a valid integer.
|
The integer returned must be interpreted as a time interval
in milliseconds. This interval begins when action is executed.
A failed and timed out fetch returns the
error.elasticconnector.createindex event.
|
[+] createdoc
Name
|
Required
|
Type
|
Def. value
|
Valid values
|
Description
|
requestid
|
false
|
Location expression
|
none
|
Any valid location expression which represents a string.
|
This is the location for the request ID that is returned as
part of this request. Standard attribute of all
Orchestration actions.
|
id
|
false
|
Value expression
|
none
|
Any value expression that returns a valid string
|
Elasticsearch document within an index. If not specified, ID
will be automatically generated. Explicit ID assignment and
automatic ID generation cannot be mixed within same index.
|
index
|
true
|
Value expression
|
none
|
Any value expression that returns a valid string.
|
Elasticsearch index name
|
type
|
true
|
Value expression
|
none
|
Any value expression that returns a valid string.
|
Elasticsearch type name
|
request
|
true
|
Value expression
|
none
|
Any valid ECMAScript object
|
Object that represents the whole body of an Elasticsearch create
document API request.
|
bulk
|
false
|
Boolean expression
|
false
|
true,false
|
If true, Elasticsearch request will be just added to the ORS
bulk request buffer and the elasticconnector.createdoc.done
event will be raised immediately. If false, a request to create
document will be sent to Elasticsearch and the
corresponding event and elasticconnector.createdoc.done or
error.elasticconnector.createdoc will be raised after
response from Elasticsearch.
|
timeout
|
false
|
Value expression
|
0
|
Any value expression that returns a valid integer.
|
The integer returned must be interpreted as a time
interval in milliseconds. This interval begins when
action is executed. A failed and timed out fetch
returns the error.elasticconnector.createdoc event.
|
[+] updatedoc
Name
|
Required
|
Type
|
Def. value
|
Valid values
|
Description
|
requestid
|
false
|
Location expression
|
none
|
Any valid location expression which represents a string.
|
This is the location for the request ID that is returned as
part of this request. Standard attribute of all
Orchestration actions.
|
id
|
true
|
Value expression
|
none
|
Any value expression that returns a valid string.
|
Elasticsearch document ID within an index.
|
index
|
false
|
Value expression
|
Current session daily index.
|
Any value expression that returns a valid string.
|
Elasticsearch index name. If not specified, current session
daily index will be used. Also, in this case, the type attribute
must be not specified, or the action will fail.
|
type
|
false
|
Value expression
|
“session”
|
Any value expression that returns a valid string.
|
Elasticsearch type name. If not specified, the “index”
attribute should be not specified as well and “session”
type will be used.
|
request
|
true
|
Value expression
|
none
|
Any valid ECMAScript object
|
Object that represents the whole body of an Elasticsearch
update document API request.
|
bulk
|
false
|
Boolean expression
|
true
|
true,false
|
If true, Elasticsearch request will be just added to ORS
bulk request buffer and elasticconnector.updatedoc.done
event will be raised immediately. If false, request to
update document will be sent to Elasticsearch and
corresponding event elasticconnector.updatedoc.done
or error.elasticconnector.updatedoc will be raised after
response from Elasticsearch.
|
timeout
|
false
|
Value expression
|
0
|
Any value expression that returns a valid integer.
|
The integer returned is interpreted as a time
interval in milliseconds. This interval begins when
the action is executed. A failed and timed out fetch
returns the error.elasticconnector.updatedoc event.
|
[+] deletedoc
Name
|
Required
|
Type
|
Def. value
|
Valid values
|
Description
|
requestid
|
false
|
Location expression
|
none
|
Any valid location expression which represents a string.
|
This is the location for the request ID that is returned as
part of this request. Standard attribute of all
Orchestration actions.
|
id
|
true
|
Value expression
|
none
|
Any value expression that returns a valid string.
|
Elasticsearch document ID within an index.
|
index
|
true
|
Value expression
|
none
|
Any value expression that returns a valid string.
|
Elasticsearch index name
|
type
|
true
|
Value expression
|
none
|
Any value expression that returns a valid string.
|
Elasticsearch type name
|
bulk
|
true
|
Boolean expression
|
true
|
true,false
|
If true, Elasticsearch request will be added to ORS
bulk request buffer and elasticconnector.deletedoc.done
will be raised immediately. If false, request to delete
document will be sent to Elasticsearch and corresponding
elasticconnector.deletedoc.done or
error.elasticconnector.deletedoc event will be raised after
response from Elasticsearch.
|
timeout
|
false
|
Value expression
|
0
|
Any value expression that returns a valid integer.
|
The integer returned is interpreted as a time
interval in milliseconds. This interval begins when the action is
executed. A failed and timed out fetch returns the
error.elasticconnector.deletedoc event.
|
Events
The following Events are supported:
[+] Events
}
Name
|
Attributes
|
Description
|
elasticconnector.createindextemplate.done
|
|
This event indicates the success of the request.
|
requestid
|
This is the ID of the request.
|
error.elasticconnector. createindextemplate
|
|
This indicates that an error occurred while trying to
perform the createindextemplate request.
|
requestid
|
This is the ID associated with the request.
|
error
|
This is the type of error that occurred. The following is a
specific error code:
protocol.errorcode - This represents the protocol-specific
errors that occur when the attempting the request.
|
description
|
This is a more detailed description of the error
|
elasticconnector.createdoc.done
|
|
This event indicates the success of the request.
|
id
|
This is ID of created document.
|
requestid
|
This is the ID of the request.
|
error.elasticconnector.createdoc
|
|
This indicates that an error occurred while trying to
perform the createdoc request.
|
requestid
|
This is the ID associated with the request.
|
error
|
This is the type of error that occurred. The following is a
specific error code:
protocol.errorcode - This represents the protocol-specific
errors that occur when the attempting the request.
|
description
|
This is a more detailed description of the error
|
elasticconnector.updatedoc.done
|
|
This event indicates the success of the request.
|
Requestid
|
This is the ID of the request.
|
error.elasticconnector.updatedoc
|
|
This indicates that an error occurred while trying to
perform the updatedoc request.
|
Requestid
|
This is the ID associated with the request.
|
Error
|
This is the type of error that occurred. The following is a
specific error code:
protocol.errorcode - This represents the protocol-specific
errors that occur when the attempting the request.
|
Description
|
This is a more detailed description of the error
|
elasticconnector.deletedoc.done
|
|
This event indicates the success of the request.
|
Requestid
|
This is the ID of the request.
|
error.elasticconnector.deletedoc
|
|
This indicates that an error occurred while trying to
perform the deletedoc request.
|
Requestid
|
This is the ID associated with the request.
|
Error
|
This is the type of error that occurred. The following is a
specific error code:
protocol.errorcode - This represents the protocol-specific
errors that occur when the attempting the request.
|
Description
|
This is a more detailed description of the error
|
Configuration for Elasticsearch
To configure these enhancements in Elasticsearch, edit the elasticsearch.yml file:
- es.script.engine.groovy.indexed.update: true.
See Configuring Elasticsearch for Orchestration.
Session and Performance Enhancement Limitations
Elasticsearch v 1.7.3 is not supported for these enhancements as it does not support the Date Format that ORS uses.
Kibana Visualization Samples
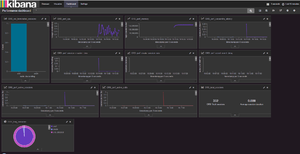
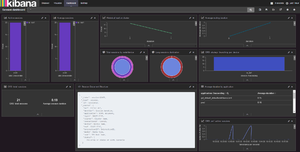
Starting with Release 8.1.400.58, ORS installation includes samples of Kibana dashboards and visualizations of data stored by ORS Elasticsearch Connector into Elasticsearch. ORS installation brings two sets of samples in folders located in the directory where ORS is installed:
- Composer Project sample located in \elasticsearch\kibana_dashboard_sample\composer. The provided Composer project contains SCXML strategies configured to store data into Elasticsearch that will be retrieved and presented in the Kibana visualizations.
- Samples of Kibana dashboards and visualizations located in \elasticsearch\kibana_dashboard_sample\kibana.
To load the dashboards/visualizations, execute script \elasticsearch\kibana_dashboard_sample\kibana
- Unix: ./load.sh -url "http://<elasticsearch host>:9200"
- Windows: .\load.ps1 -url "http://<elasticsearch host>:9200"
The performance visualizations are based on predefined <alarm-name>(s) configured in the performance-alarms section imported from the ORS Application template.
Click to open expanded views of the samples. Click the "X" to close.

