Performance and Sizing Data
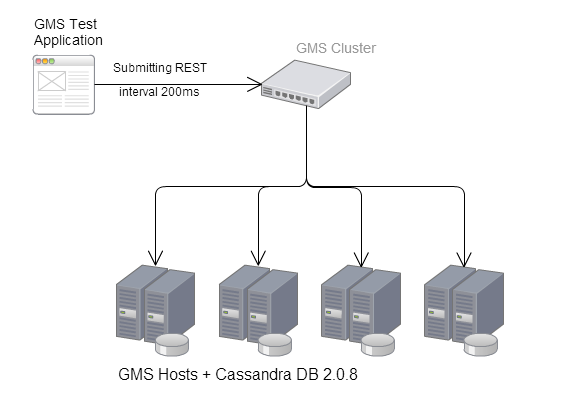
This page provides an example of sizing and performance for Context Services in a GMS deployment.
Contents
Sizing Results
| Captured measure | Value | Comments |
|---|---|---|
| CPU | ~20% to 60% | Each node was around an average of 30% with peaks to 60% from time to time. |
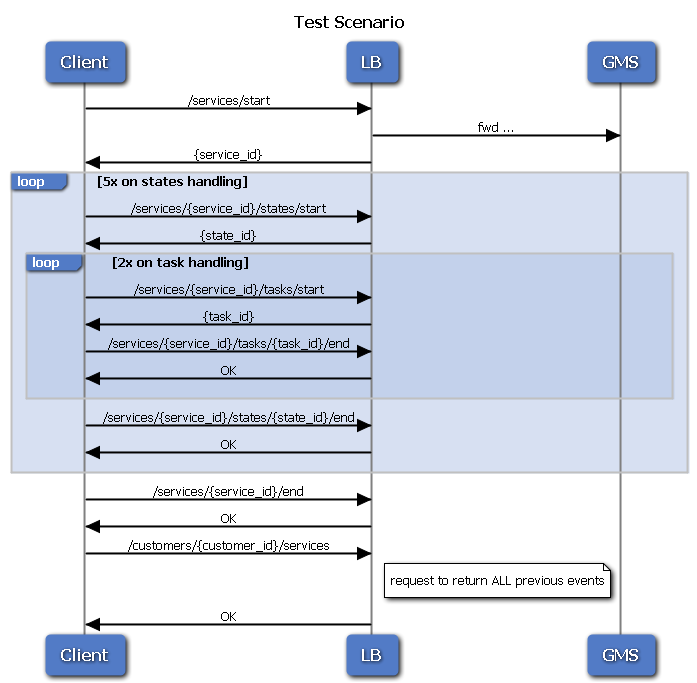
| Database size | 68 GB / node (after 120h) = 272 GB | 272 GB corresponds to 16.5 M conversations or 264 M service/state/task events, for a ratio of 0.54KB per conversation (1 service, 5 states, 10 tasks). |
| I/O Disk | ~3 MB /s (Cassandra measure) | Disk I/Os are fluctuating a lot (between 0 MB/s and 20 MB/s) |
| I/O Network | ~3 MB /s | Between 20Mbps and 60Mbps. |
| Memory | 2.4GB | For each GMS processes. Less than 2 GB for Cassandra processes. |
| Size of conversation (1 service, 5 states, 10 tasks) | ~10kB in JSON | This matches a conversation (1 service, 5 states, 10 tasks), for 33 REST queries events, including extension data returned with queries by CustomerId. |
| Throughput | ~1000 queries/s
(~30,5 scenario/s) |
Constant through 24 hours of testing |
This page was last edited on April 27, 2017, at 10:03.
Comments or questions about this documentation? Contact us for support!


