Contents
Using Pulse
<tabber> |-| Overview=
Pulse Templates
You use a template to define the statistics you want to include in a report and how to display the statistics in a widget. Any Pulse user can use any template available in your instance of Pulse.
Note: The template itself does not display statistical results; the widget you create based on the template is what displays them.
To create a Pulse template, you must add or configure:
- One or more object types.
- One or more statistics.
- One widget type with specific options to display the information.
Pulse provides a basic set of templates, complete with statistics that are typical for reporting activities handled by Genesys solutions.
The Template wizard screens
The Template Wizard guides you through the process of creating, modifying, and deleting templates and consists of the following dialog boxes:
- Template Definition
- Predefined Statistics
- Displayed options
How to Run the Template Wizard
To use the Template Wizard you must meet the conditions listed below. Otherwise, Pulse deactivates the Template Wizard icon on the toolbar.
- You must have access to Pulse dashboards.
- Your user account must have the right privileges to manage templates and default dashboard.
To invoke this Wizard, do either of the following:
- From the dashboard menu, click the ’add widget’ menu item and select ’new Template’.
- From the dashboard, click on the ’add widget’ item and select ’new Template’
|-| Template Definition=
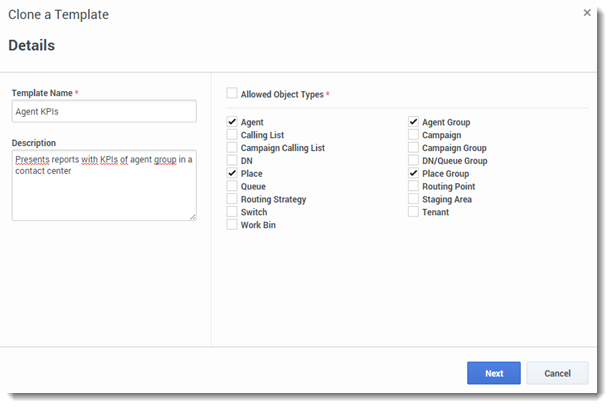
Template Definition
|
Compatibility set basic rule
There is no strict rule about what combination of object types can be selected for a template but as a basic rule, you can only select object types that are compliant with all statistics of your templates.
As an example, the ’Agent KPI’ template proposes a set of statistics with common object properties defined in the Genesys Stat Server options which are matching with ’Agent’, ’Agent Group’, ’Place’ and Place Group’ so any of these four options are applicable.
The ’Agent Group Status’ template proposes a set of statistics with common object properties defined in the Genesys Stat Server options which are matching with ’Agent Group’ and ’Place Group’ so only those two options are applicable.
As you noticed the nature of the statistic definitions is limiting the choice of selection for the object type.
|-| Predefined Statistics =
Predefined Statistics
To speed up this step, it is recommended to edit or clone an existing template to have a pre-defined example.
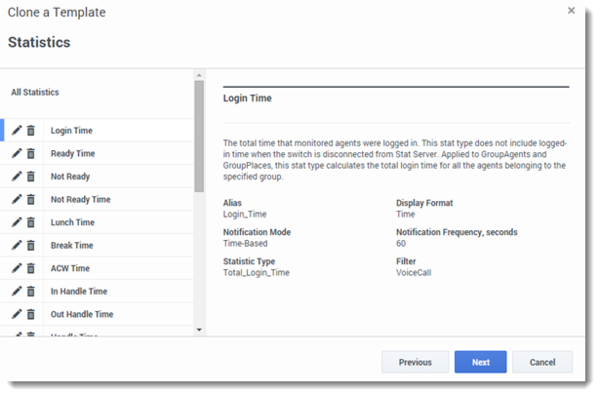
The second step of the wizard defines the statistics to be included in the templates with the respective properties.
|
Alias: Represents the technical name of the statistics and must be unique across the template. The first letter should start with an ASCII letter.
Display Alias: Represents the alias displayed on the report.
Description: Describes the functional meaning of the statistic.
Display Format: Defines the format of the statistic. The format specifies whether values are shown as time or numbers, and, if numbers, how many decimal places they show. Depending on the statistic you chose, the available formats in the drop-down list might be time-based, numerical.
List of values: Time, Integer, Number, Percent, String
Insensitivity: Describes a condition for Stat Server to send updates of statistical values to its clients. An increase in the value of this parameter usually decreases network traffic, but it also reduces reporting accuracy, because values are not updated as frequently. This setting is not visible in Stat Server configuration, but rather, clients pass its value to Stat Server along with each statistic request.
Insensitivity plays no role for reset-based statistics. For time-based or change-based notification mode, Stat Server only reports the recalculated value if the absolute value of the difference between the previous value and the recalculated value or its percentage ratio to recalculated value is at least equal to the number specified by insensitivity.
If the result has a long integer data type—as is the case for statistics measuring time—Stat Server uses the absolute difference in values for comparison. Given an Insensitivity setting of 5 in this case, Stat Server sends the recalculated result to its client when the absolute value of the difference between the new and old result is at least 5 (seconds, usually).
Notification Mode: Determines when Stat Server sends updated statistical values. These are the valid options:
- Time-Based
- Change-Based
- No Notification
- Reset-Based
Selecting Time-Based Notification mode instructs Stat Server to recalculate the statistic by the frequency displayed in Notification Frequency. Stat Server sends a new value to Pulse only when the absolute difference from the last reported value exceeds the insensitivity parameter. Selecting Change-Based Notification mode instructs Stat Server to notify Pulse about changes immediately.
Notification Frequency: Sets how often, in seconds, Stat Server should recalculate the statistic and notify Pulse if the statistic changes by more than the valued displayed in the Insensitivity field. This field is only used when a Time-Based Notification mode is selected for the statistic.
Statistic Type: Displays the parameters that define the statistical type within Stat Server. This field is mandatory.
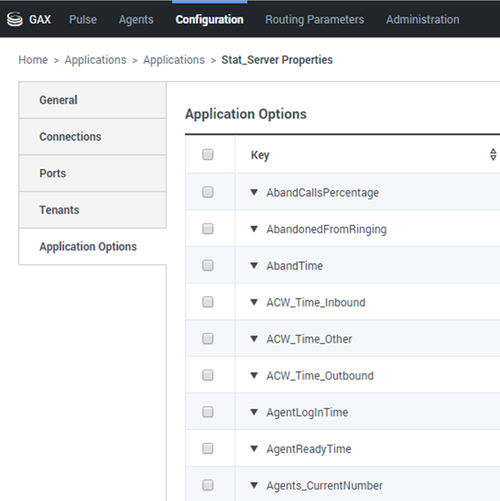
| The list of ’Statistic Type’ available in the environment should be accessible via the Genesys Administrator UI in the configuration module. This view is available in the options of the Stat Server application used by the Pulse solution. You need to have the right privileges to access this section. The administration interface enables you to add, edit or delete a statistic type. The list should be similar to the list of statistic type detailed in the Pulse out-of-box templates spreadsheet. For further information on stat type definitions, refer to the Framework Stat Server User’s Guide. |
Time Profile':' Defines the time profile for the statistic and specify the interval over which historical aggregate values are calculated. All time profiles are defined as configuration options in the Time Profiles of the Stat Server Application object in Genesys Configuration. Refer to the Framework Stat Server User’s Guide' for information about how to set up time profiles.
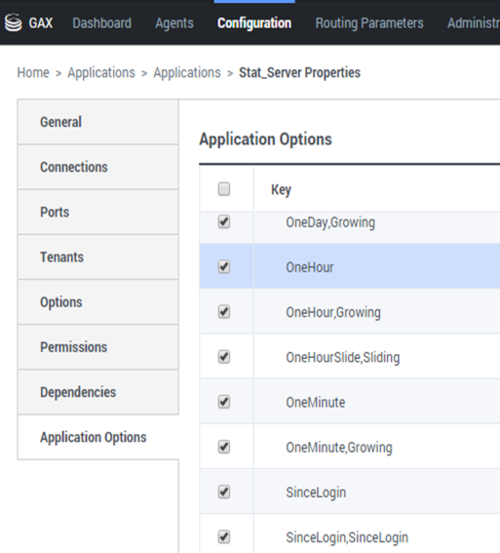
| The list of ’Time Profiles’ available in the environment should be accessible via the Genesys Administrator UI in the configuration module. This view is available in the options of the Stat Server application used by the Pulse solution. You need to have the right privileges to access this section. The administration interface enables you to add, edit or delete a time profile. The time profile contains four main types:
|
See below a few examples of time profiles:
| Description | Option key | Option value |
| The Default time profile uses a Growing interval type and resets statistics to zero (0) every night at midnight. | Default,Growing | 00:00 |
| The LastHour time profile uses a Sliding interval type and tracks the last hour of activity with a sampling taken every 15 seconds | LastHour,Sliding | 3600:15 |
| SinceLogin resets such statistics to zero (0) at the moment of agent login. Statistics continue to accumulate as long as the agent is logged into (any) DN. The SinceLogin interval type aggregates statistical data only for agent-object statistics | SinceLogin,SinceLogin | |
| Suppose that you want to set up a time profile (named Shifts) that resets statistics to zero when shifts change at 3:00 AM, 7:00 AM, 11:00 AM, 1:00 PM, 7:00 PM, and 1:00 AM | Shifts,Growing | 3:00 +4:00, 13:00 +6:00 |
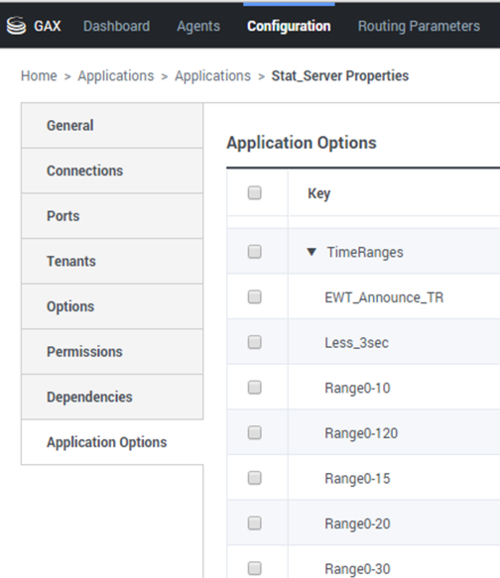
' Time Range'''': Defines a time range for collecting data for a limited set of statistics. Refer to the Framework Stat Server User’s Guide' for information about how to set up time profiles
| The list of ’Time Ranges’ available in the environment should be accessible via the Genesys Administrator UI in the configuration module. This view is available in the options of the Stat Server application used by the Pulse solution. You need to have the right privileges to access this section. The administration interface enables you to add, edit or delete a time range. Time Ranges are applicable to statistics belonging to the following statistical categories:
|
See below a few examples of usage for time ranges:
Suppose that you want to calculate the total number of calls answered within 30 seconds based on a specified time range. To do so, enter Range0-30 in the Name field and 0-30 in the Valuefield.
In this example, a statistic that calculates the total number of calls would be based on the time range "Range0-30" if configured so in Pulse. If one call is answered after being in a queue for 25 seconds, a second call after 40 seconds, and a third call after 10 seconds, Stat Server counts only the first and third calls.
----
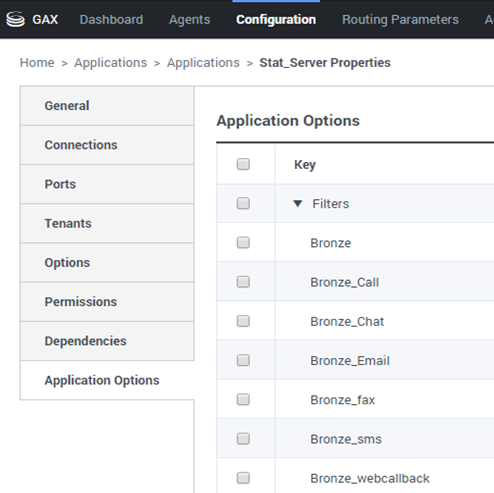
'Filters': Represents statistical filters that define restrictive conditions on action's used in computing the statistic. Refer to the Framework Stat Server User’s Guid'e "Statistical Categories" chapter to learn how to define filtered statistics
| The list of ’Filters’ available in the environment should be accessible via the Genesys Administrator UI in the configuration module. This view is available in the options of the Stat Server application used by the Pulse solution. You need to have the right privileges to access this section. The administration interface enables you to add, edit or delete a filter. |
See below a few examples of usage for filters:
Suppose that you want to filter calls based on language. If the enterprise set up the key "Language" to identify language and the value "Spanish" for callers who speak Spanish, you could use the PairExists UserData function to search for calls with attached data in the key-value pair form of Language/Spanish.
On the Options tab of the Stat Server Properties dialog box, you could add a SpanishLanguage option in the [Filters] section and specify filtering for calls with attached data containing the key "Language" and the value "Spanish".
The example would have SpanishLanguage in the Name field and PairExists("Language","Spanish") in the Value field.
Now, when an agent attaches the "Spanish/Language" key-value pair to calls from a desktop application, the calls are filtered out of statistical calculations.
|-|
Formulas=
Formulas
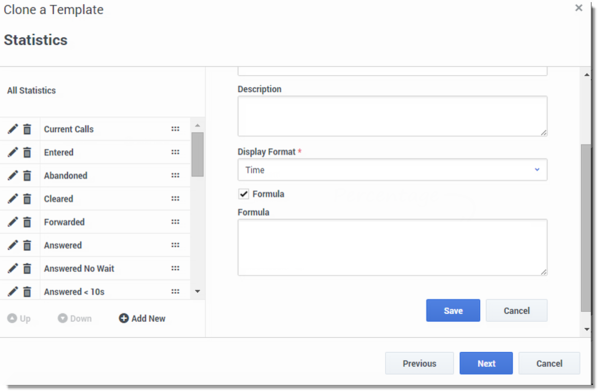
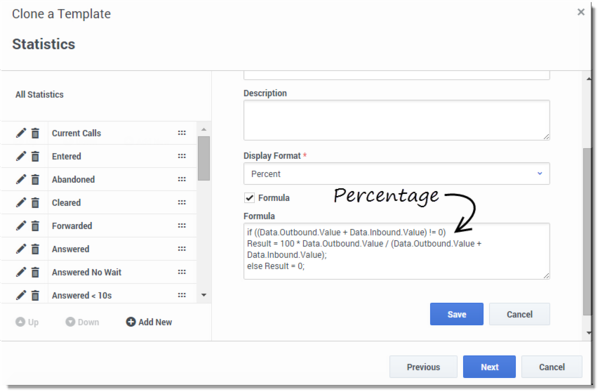
From the statistic detail page, you can create or customize statistics by creating a formula in the Formula box.
The formula is a javascript based syntax which lets you calculate a percentage based on two metrics. For instance, you can calculate the ratio of the calls abandoned to the calls offered in your queue and measure the percentage of abandoned calls in queue.
This formula assumes the offered calls are defined by a statistic alias Offered and the abandoned calls are defined by a statistic alias Abandoned.
The formula must return a Result value to be valid and can access any statistics of the template with the following syntax - Data.<Statistic-Alias>.Value |-| Displays Options=
Displays Options
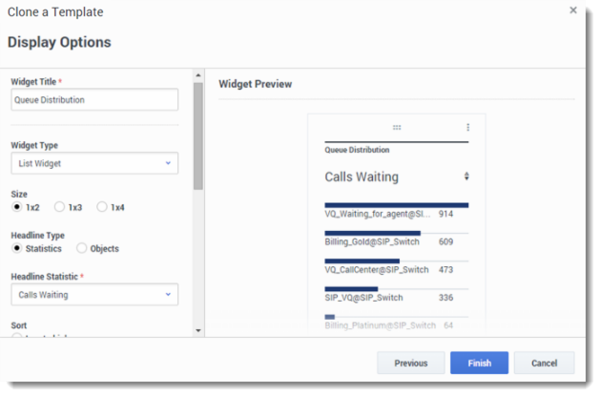
The final step before validating your template is to define what should be the default display of your widget on the main dashboard. This setting will be the one displayed to Pulse users but they will be free to modify the widget options on their own dashboard.
| Name the widget title Select the Widget Type to display:
|

