Routing Analysis
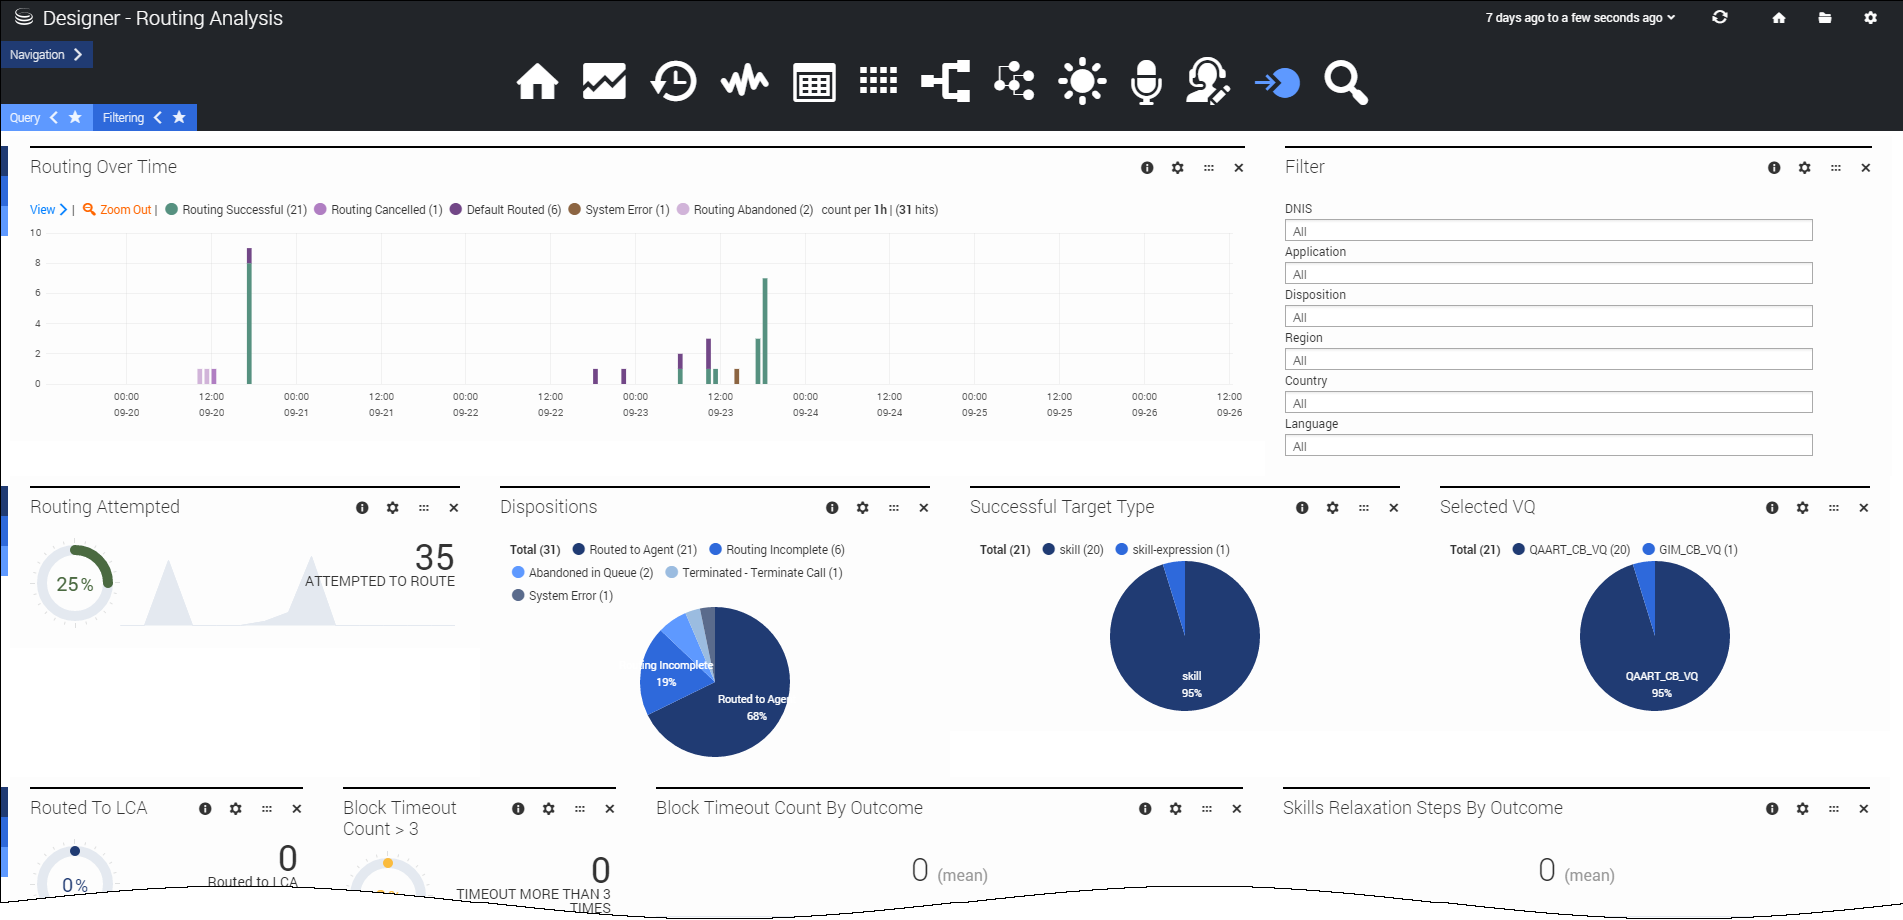
This dashboard gives you a deeper look into those sessions that have entered the Assisted Service phase of the applications.
These reports can help to answer questions like:
- How many sessions were successfully routed to their destination?
- How long are callers waiting in the queue before hanging up?
- Which applications had the lowest abandoned rates?
- Which blocks had the least number of timeouts?
Reports on this dashboard
Routing Over Time
The total number of routing sessions that happened during the given time period, broken down by status (such as, if the routing session was abandoned, successful, cancelled, default routed, or had an error).
Filter
(See the Summary dashboard for a description of this panel.)
Routing Attempted
The total count and percentage of sessions that entered the routing phase (based on the number of all sessions processed during the given time period).
Routed to LCA
The number of sessions that were successfully routed to the last called agent (that is, the agent that the customer last spoke with).
Timeout Block Count > 3
The total count and percentage of all routing sessions where the routing blocks had three (3) or more timeouts.
Predictive Routing Attempted Count > 3
The total count and percentage of sessions where three (3) or more predictive routing attempts were made.
Dispositions
The total number of routing attempts made, broken down by final disposition.
Successful Target Type
The number of sessions that were successfully routed to the target, broken down by target type (such as a specific skill).
Selected VQ
The number of sessions that were successfully routed to the selected virtual queue.
Predictive Dispositions
The total number of predictive routing attempts made, broken down by final disposition.
Successful Predictive Target Type
The number of sessions that were successfully routed to the target by predictive routing, broken down by target type (such as a specific skill).
Predictive Selected VQ
The number of sessions that were successfully routed to the selected virtual queue by predictive routing.
Block Timeout Count by Outcome
The total count, including the minimum, maximum, and mean, of routing block timeouts experienced by routing sessions, broken down by routing outcome (positive/negative).
Skills Relaxation Steps by Outcome
The total count, including the minimum, maximum, and mean, of skill relaxation steps, broken down by routing outcome (positive/negative).
Predictive Routing Attempted By Outcome
The total count, including the minimum, maximum, and mean, of predictive routing attempts, broken down by routing outcome (positive/negative).
Average Time in Queue (in seconds)
The average amount of time that sessions waited in the queue before being routed.
Abandoned in Queue Stats
Details about routing sessions that were abandoned while still in the queue, such as how long callers waited before hanging up.
Performance Report by Applications
This table shows the performance breakdown by individual applications, as based on a variety of metrics. This panel lets you see which applications have the best (or worst) performance.
Performance Report by Blocks within Applications
This table shows the performance breakdown by individual blocks, as based on a variety of metrics. This panel lets you see which blocks have the best (or worst) performance for any given application.
Skills Path
This panel provides a sankey visualization of the skills path. (By default, the depth of this panel is set to 7.)
Abandoned in Queue Stats
This panel provides a sunburst visualization of the Abandoned in Queue stats.

