Contents
Getting Started
The following sections provide an overview of the UI.
Login
You can log into the UI hub at this URL: <GMS Local Host>:8080/genesys
The UI hub displays all of the UIs available to the user based on their roles. The Hub is the home of the UIs; you can return to the hub from any UI by clicking Home.
Use the login credentials that were configured during the Creating and Configuring the GMS Application Object procedure. For example, default/password. Your access will also depend on the role-based access that was configured in the same procedure.
Browser support is listed in the Genesys Supported Operating Environment Reference Guide.
Monitor
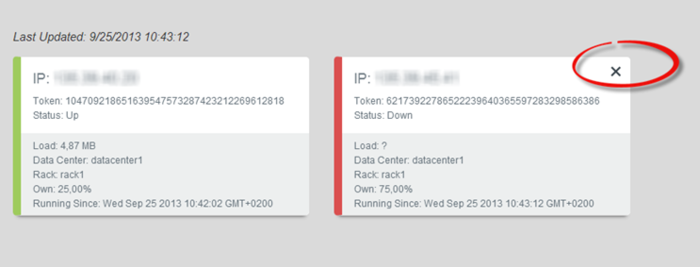
The Monitor tab displays the current health of the GMS nodes, and is the first screen that appears after logging into the UI.
The following figure shows an example of two GMS nodes. The green bar on the left shows that the system status of one node is up. The red bar reflects a down system status for the other node. You can remove the down node from the GMS cluster by using the X button, as shown in the upper right. Important: If a node goes down for more than 45 minutes, you should remove it from the cluster.
The Monitor screen refreshes every three minutes.
Services
The Services tab enables you to manage Callbacks, and to manage the service templates, which contain defined parameters. Before you can get started managing the services, you must first load the service templates through the Tools tab. Once a service template has been loaded, the Services tab has the following features:
Configured Services
The service templates that you loaded will be available in the drop-down list on the right. You can now add, and then manage your services based on the templates. The services and categories can be collapsed or expanded for easier viewing, and you can set the quantity of services per page. (For a Chrome browser, Genesys recommends 10 services per page, and for Mozilla, 5 services per page.)
The service is also created in the service.{service-execution-name} section of your GMS configuration. The URLs used by the Service API are dependent on the name of the service that you have just created. Services are available at the following URL:
http://host:port/genesys/1/service/{service-execution-name}For instance, if you create a service named match-interaction, then {service-execution-name} is match-interaction and the service is available at:
http://host:port/genesys/1/service/match-interactionKey parameters for the service are automatically populated with the appropriate default values. For cluster configurations, all changes made in a service will be replicated into the entire GMS cluster. The parameters have the following characteristics:
- Mandatory parameters - are identified with a lock icon; you cannot rename them or remove them.
- Optional parameters - you can rename them by hovering your cursor over the value field (you will see a pencil icon), click, and then enter the new value. You can delete optional parameters by clicking on the X on the right side.
- Advanced parameters - can be hidden by selecting the check box in the upper right.
- Request parameters - are identified with an i icon, which displays a hint when your cursor hovers over it.
Important: Request parameters are usually provided within the request itself. Genesys recommends that you do not configure the Request parameters through this UI, otherwise the parameter within the request will be overridden. If a value was entered through this UI and you wish to remove it at some later date, you can click on the garbage can icon and the value becomes not specified.
The following figure shows an example of a service.
Callback
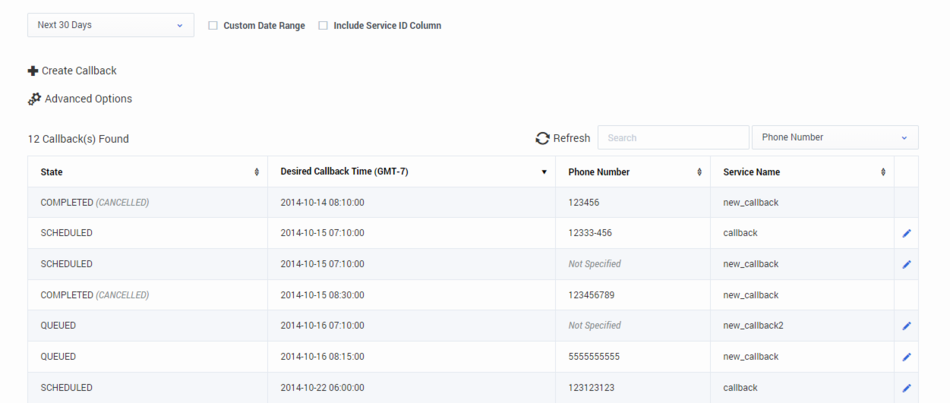
The Callback UI displays completed and scheduled Callbacks.
Notes:
- After the Callback due date (which is the _desired_time parameter), the service record will appear in the UI for the amount of time configured in the _ttl parameter (in seconds).
- You must have the appropriate role-based access in order to view the Callback UI.
The following features are available:
- The dropdown at the top left gives you the option to display Callbacks using a pre-defined range for the past day, week, or month; or for the next day, week, or month.
- Custom Date Range - You can select a custom range by selecting this check box and specifying a start-time and end-time. The maximum range is one month.
- Include Service ID Column - Selecting this check box includes the Service ID column in the table.
- Create Callback - Opens a new window where you can add a new Callback to be displayed. You can select the Callback Type and Service Name, add your own properties to the Callback, and enter the following Callback Parameters:
- Customer Number - Your Callback number.
- _urs_virtual_queue - Queue to use for this Callback if several virtual queues are used for Callback with identical configuration. If you are defining the _urs_virtual_queue here, you must then remove this option from the Callback Service (through Configuration Manager), as it cannot be defined in both places.
- _request_queue_time_stat - Queue statistics. For example, "ExpectedWaitTime;Queue;8999@SIP_Server;Environment".
Note: Make sure that the selected service has the parameter _wait_for_user_confirm = false.
- Advanced Options - Opens a new window where you can customize how the Callback Management table displays:
- Add Column Field - You can add your own custom column field to display in the table. This option can be useful when you have created your own properties that you want to display in the table. You can add more than one field, which will display in the same column. In this case, to enhance readability in the single column, you can use the Alias option, and create a short name to display.
- Filter Table by States and Service - You can include one or more states to display in the table, and/or you can select a service to display in the table. Note: You can only select one service at a time to display. The states are:
- SCHEDULED - Request is handled by Callback Management service (there are no sessions started in ORS). While in this state, the request will be handled by Management when the specified desired_time is upcoming.
- QUEUED - Callbacks actively waiting for agent in ORS/URS; agent not assigned yet.
- ROUTING - Agent is reserved but the call is not yet routed to the agent.
- PROCESSING - Callback being handled by assigned agents.
- COMPLETED - Callback was completed with _callback_reason, for example, timed-out, cancelled, and so on.
- Max # of Callbacks per Service - Default is 500.
- In the Callback table, for Callbacks that can be edited, a blue pencil displays in the last column. Clicking this pencil display the edit options for that Callback.
- You can choose to reschedule the Callback (only for SCHEDULED Callbacks).
- You can choose to cancel the Callback.
Reporting
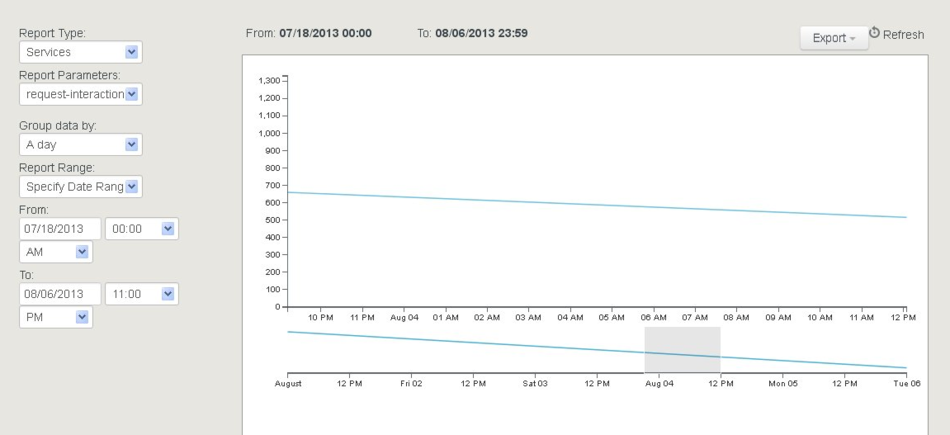
The Reporting tab is a dashboard that displays current resource and service utilization. You can select pre-defined date and time ranges, and export the reports into CSV, PDF, or Excel file formats. You also have the ability to zoom into a selected area of the graph to view additional detail.
Four types of reports are available:
- Resources - Displays the usage history of the selected Resource group. Note: These are the Resource groups that were defined in the Tools tab.
- Services - Displays the aggregated total a service was accessed for a given time period.
- Callback - Displays Callback services data, if the Callback services are active.
- Display Advanced Metrics - When this option is selected, you can choose between a metric type of Holdtime or Watermark.
- Holdtime - You can set parameters for displaying the HoldTime statistics (media type, rollup-range, and time range).
- Watermark - For Callbacks in the QUEUED state, you can display high, low, and average water marks (AVG, MIN, MAX) over time periods of 15-minutes, 30-minutes, an hour, or a day. Note that the Watermark is computed every minute, so for example, running 20 Callbacks simultaneously within a one minute period, then none for the rest of the same 15 minute period, will result in Min=0,Max=20 and Avg=1.
- Display Advanced Metrics - When this option is selected, you can choose between a metric type of Holdtime or Watermark.
- Operational metrics - DNIS pool usage and availability.
- DNA availability by pool – Determines, in real-time, the number of outstanding service requests (or available resources) by resource pool.
- Average Handle Time (AHT) by resource pool – Reports historical AHT, in seconds, by resource pool summarized by 15-minutes, 30-minutes, an hour, a day, or over a range of periods such as today, yesterday, last week, last month, or a range of dates. Timeouts do not impact the calculation.
- Service Exiting Reporting — Reports on historical service terminations (match or timeout) by resource pool summarized by 15-minutes, 30-minutes, an hour, a day, or over a range of periods such as today, yesterday, last week, last month, or a range of dates.
Tools
Patterns
The Patterns tab enables you to configure exceptions; for example, phone numbers. The Help button displays the format for the expressions.
In the patterns group, you can test the value of a pattern against an entire group. Type a value in the input field, and if a match is found, the corresponding table row will be highlighted.
Resources
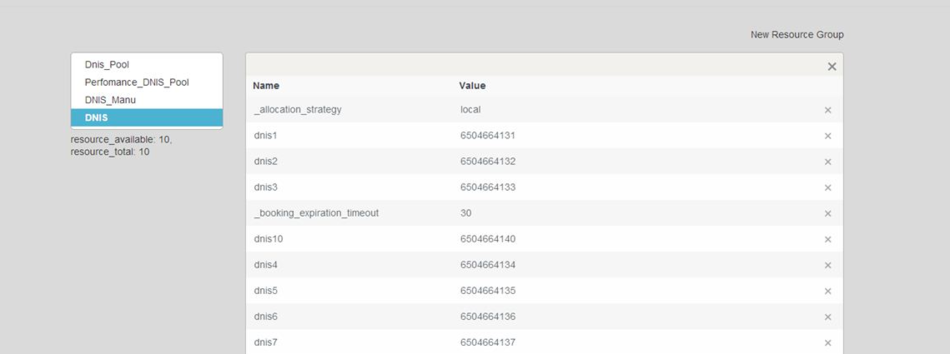
The Resources tab enables you to create new resource groups and add resources. It provides the same functionality as Resources (Configuration Database Objects) in Configuration Manager, as well as displaying available and total resources.
Service Templates
The Service Templates tab enables you to load the predefined templates that are included with GMS, or you can load your own service templates. The GMS service templates are located in the <GMS installation directory>/service_templates directory. After uploading the templates, you can configure the services in the Services screen. The following templates are available:
- callback.zip
- match-interaction.zip
- office-hours.zip
- request-access.zip
- request-chat.zip
- request-interaction.zip
- get.zip
Download DFM
The Download DFM tab enables you to download special configuration files, called DFM. (Tell me why.
)
- In your browser, open the Service Management UI with the following URL:
<GMS Local Host>:8080/genesys/ - Click Admin UI
 .
. - Select
 , then click
  . The Download DFM panel displays the list of required files.
 - Click one of the DFM file links and the download will start.
Lab
Statistics
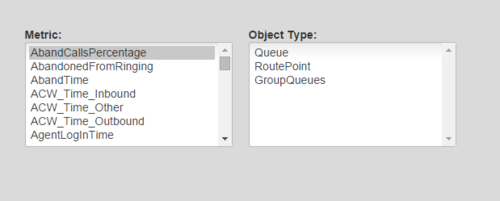
The Statistics tab displays metrics from Stat Server.
API
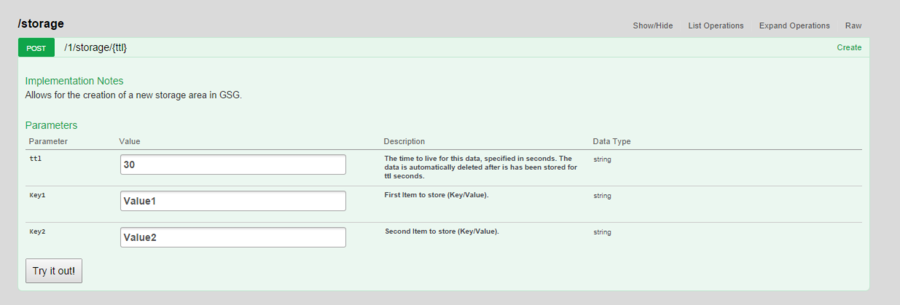
The API tab is a tool that enables you to test your services, such as having access to the request and response headers, and seeing how the response changes based on different arguments. Click on the service > URL to expand it, enter your values, and then click Try it out! You can also view the source code by clicking Raw.
Config
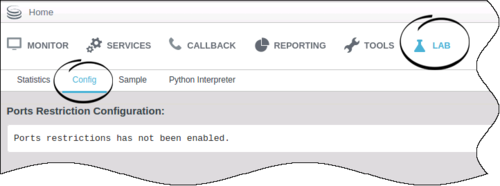
The Config tab provides you with a code snippet that you must add to the jetty.xml file for port number control. The code snippet is available when port restrictions have been enabled in Configuration Manager. See Restricting Ports for more information about using this feature.
Sample
Note: Introduced in GMS 8.5.003.
The Sample tab provides you with the ability to test your GMS deployment, and supports the scenarios described in the Callback Scenarios. This sample can also be used to test an existing GMS deployment.
The following screens are available by clicking the corresponding tabs.
- GMS - The application home screen showing which GMS scenario can be executed.
- Log - Displays log messages related to client-server communication and application debug messages.
- Chat - Allows exchange of chat messages between client and agent. Notices relating to agent status and connections are also displayed.
- Queue - For delay scenarios, checks the status of the interaction in the queue (when a request has been placed and is waiting for an agent).
- Settings - Application settings can be made on this screen.
For more information about the sample, as well as a download option, see the Client Samples.

