Admin UI
Contents
Access Admin UI
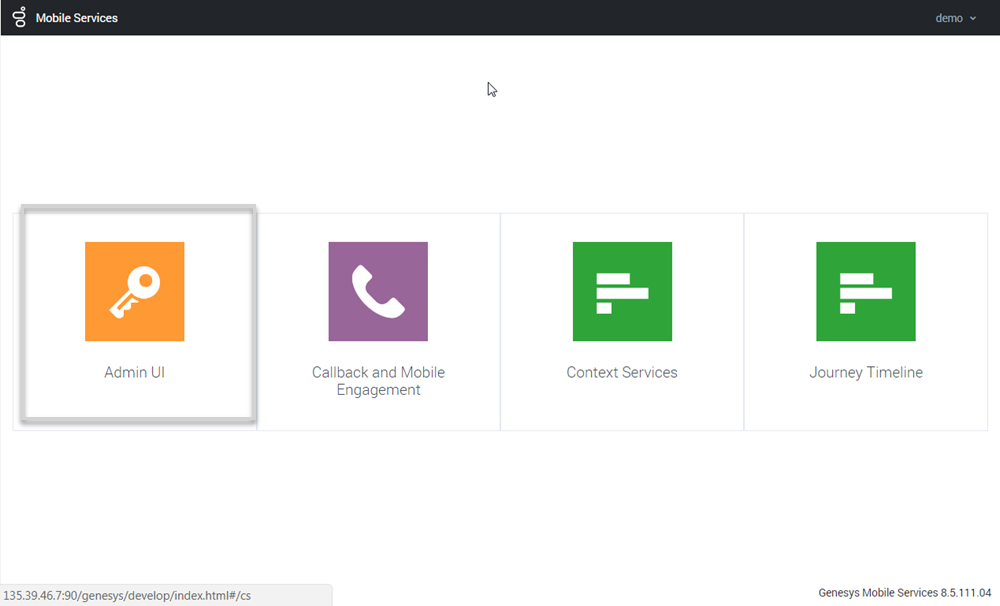
To access this interface, you must log in as a user who owns the Administrator or Supervisor role. Then, you can select the Admin UI icon.
Monitor tab
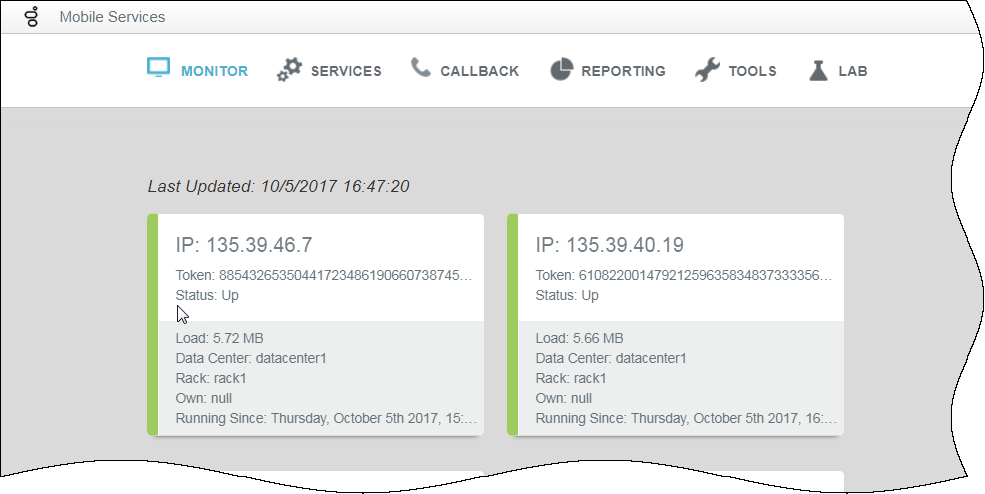
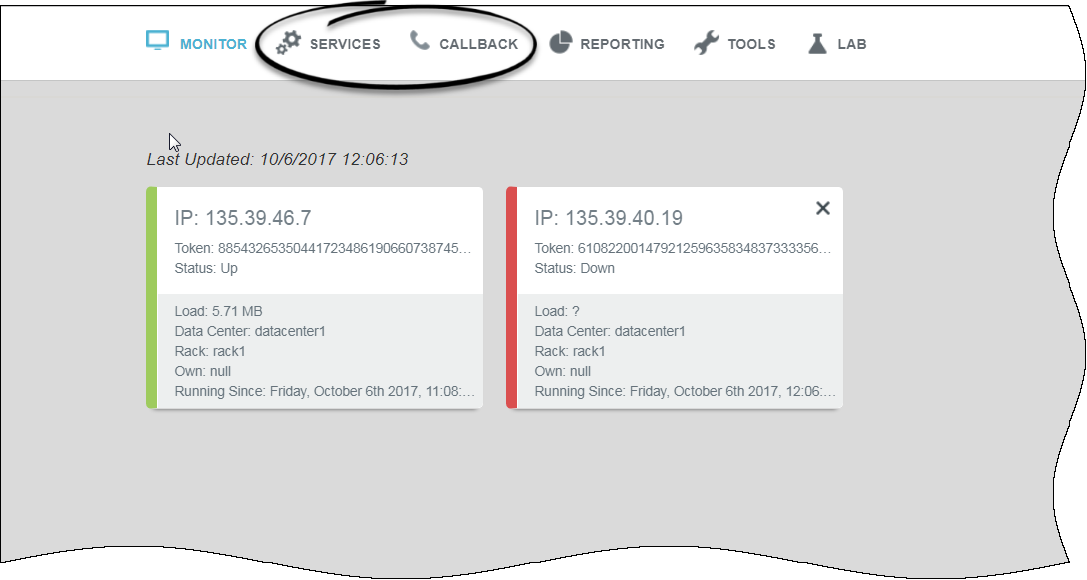
The Monitor tab displays the current health of the GMS nodes.
In this example (left), you can see two running GMS nodes. A green bar shows the system status for that node is up. A red bar means the system status for that node is down.
The Monitor screen refreshes every three minutes.
Reporting tab
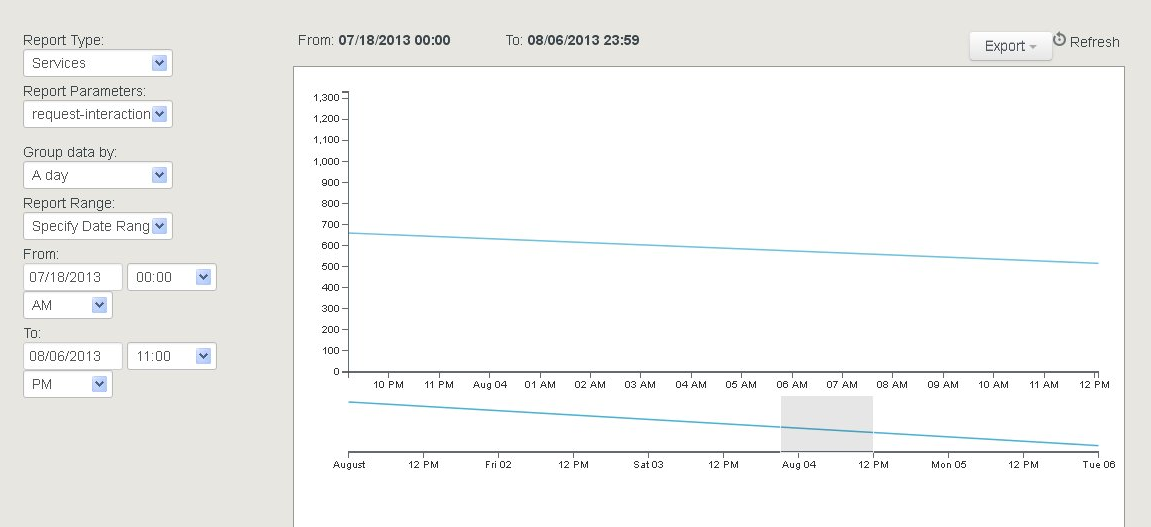
The Reporting tab is a dashboard that displays current resource and service utilization. You can select pre-defined date and time ranges, and export the reports into CSV, PDF, or Excel file formats. You also have the ability to zoom into a selected area of the graph to view additional details.
Four types of reports are available:
- Resources - Displays the usage history of the selected Resource group. Note: These are the Resource groups that were defined in the Tools tab.
- Services - Displays the aggregated total a service was accessed for a given time period.
- Callback - Displays Callback services data, if the Callback services are active.
- Display Advanced Metrics - When this option is selected, you can choose between a metric type of Holdtime or Watermark.
- Holdtime - You can set parameters for displaying the HoldTime statistics (media type, rollup-range, and time range).
- Watermark - For Callbacks in the QUEUED state, you can display high, low, and average watermarks (AVG, MIN, MAX) over time periods of 15 minutes, 30 minutes, an hour, or a day. Note that the Watermark is computed every minute, so for example, running 20 Callbacks simultaneously within a one-minute period, then none for the rest of the same 15-minute period, will result in Min=0, Max=20, and Avg=1.
- Display Advanced Metrics - When this option is selected, you can choose between a metric type of Holdtime or Watermark.
- Operational metrics - DNIS pool usage and availability.
- DNA availability by pool – Determines, in real time, the number of outstanding service requests (or available resources) by resource pool.
- Average Handle Time (AHT) by resource pool – Reports historical AHT, in seconds, by resource pool summarized by 15 minutes, 30 minutes, an hour, a day, or over a range of periods such as today, yesterday, last week, last month, or a range of dates. Timeouts do not impact the calculation.
- Service Exiting Reporting — Reports on historical service terminations (match or timeout) by resource pool summarized by 15 minutes, 30 minutes, an hour, a day, or over a range of periods such as today, yesterday, last week, last month, or a range of dates.
Tools tab
Patterns
The Patterns tab enables you to configure groups of exceptions; for example, phone numbers. The Help button displays the format for the expressions. Once you have defined some patterns, use the Pattern Matcher API queries to check the validity of your parameters. In the patterns group, you can test the value of a pattern against an entire group. Type a value in the input field, and if a match is found, the corresponding table row will be highlighted.
Resources
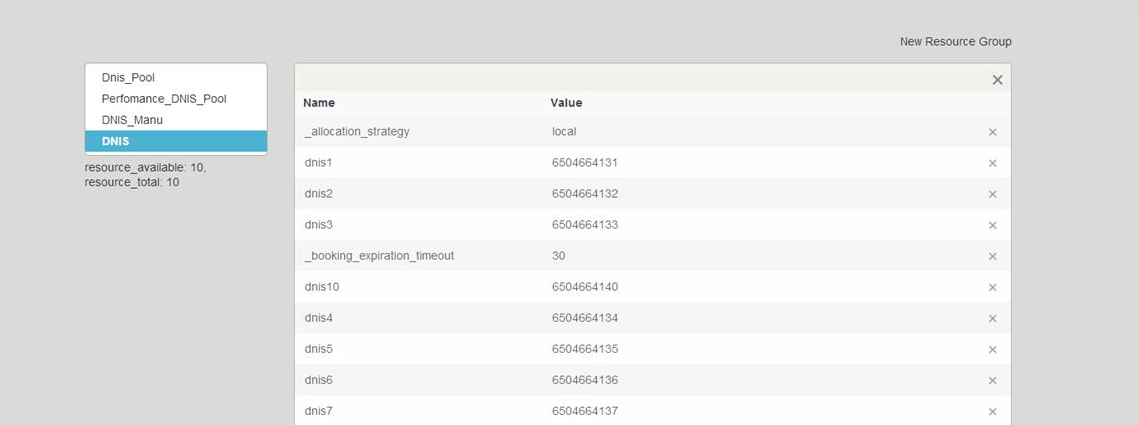
The Resources tab enables you to create new resource groups and add resources. It provides the same functionality as Resources (Configuration Database Objects) in Configuration Manager, as well as displaying available and total resources.
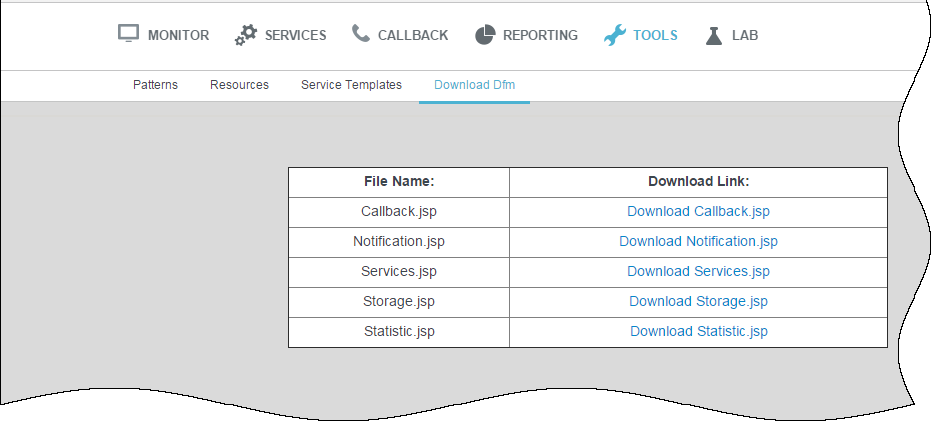
Download DFMs
Lab tab
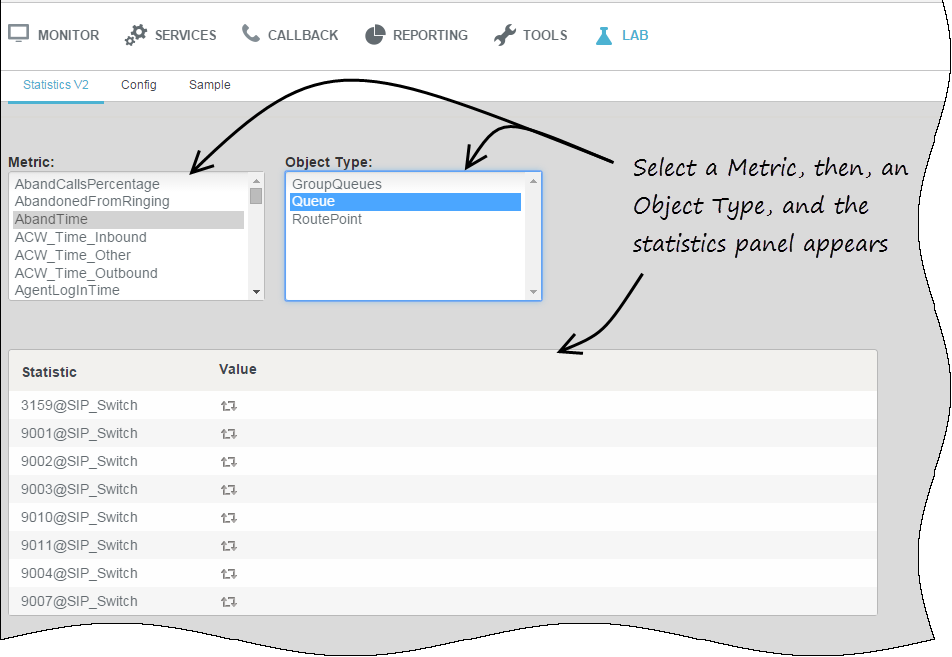
Statistics
Config
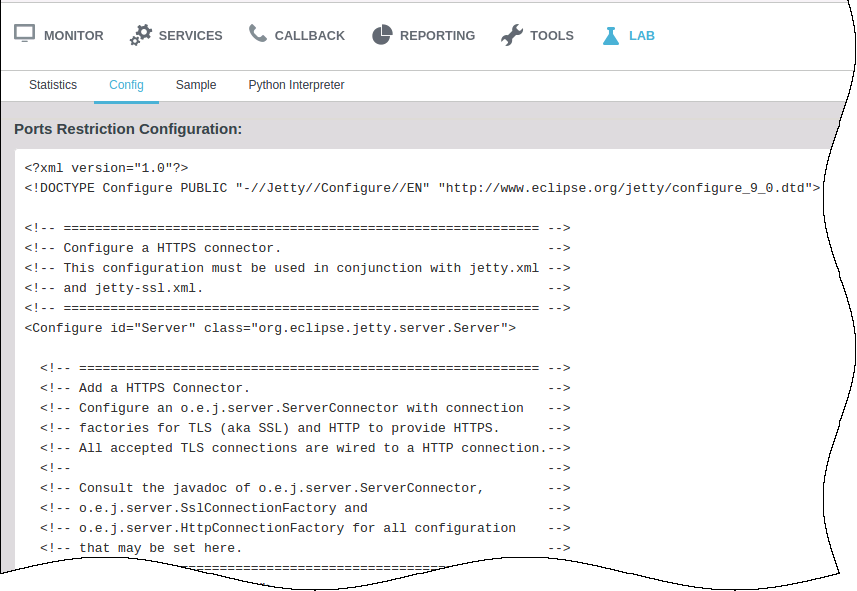
The Config tab provides you with a code snippet that you must add to the jetty-http.xml file for port number control. The code snippet is available when port restrictions have been enabled in Configuration Manager. See Restricting Ports for more information about using this feature.
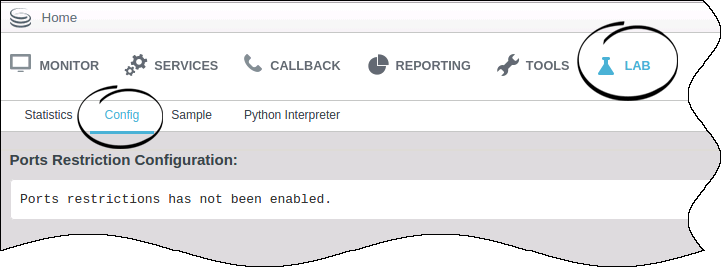
By default, restrictions are disabled and the Config Tab displays a default message.
[+] See default messageSample
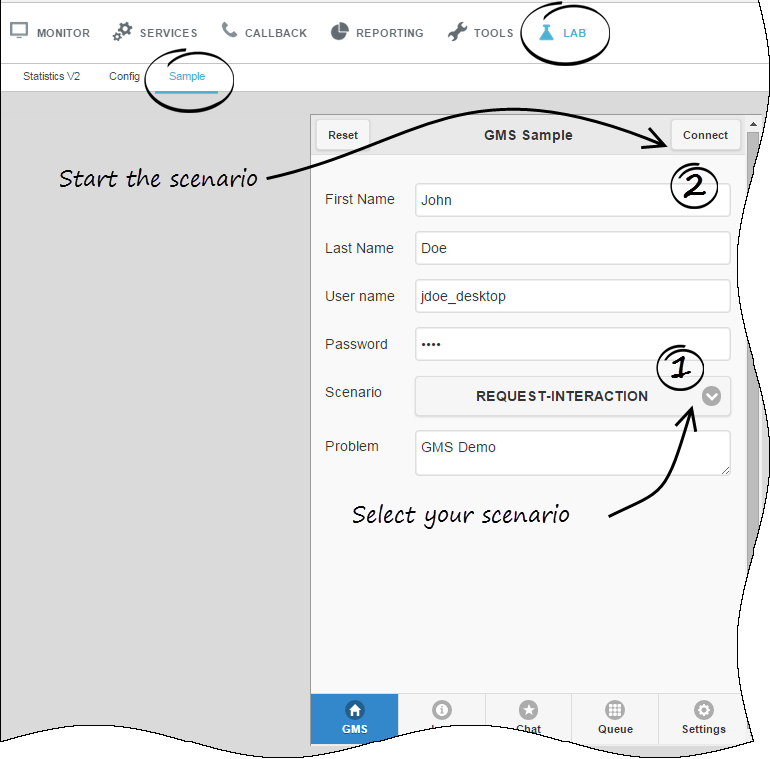
The Sample tab provides you with the ability to test your GMS deployment, and supports the scenarios described in the Callback Scenarios. This sample can also be used to test an existing GMS deployment.
For more information, as well as a download option, see the Lab Sample page.
Deprecated tabs
The Services, Callback, and Service Templates tabs are deprecated in Admin UI and redirect you to the new Configured Services, Callback, and Service Templates interfaces.

