Jump to: navigation, search

Using InTools

Overview

InTools (Instrumentation Tools) is a Chrome/Chromium extension you can use to create, validate, and test DSL.

Installation

You can install and use InTools with the Chromium Browser or the Chrome Browser. Genesys recommends that you use the Chrome Browser because it has the largest selection of Developers Tools.

Chromium (Windows, Mac, Linux) and Chrome (Mac, Linux)

The installation process is the same for Chromium (Windows, Mac, Linux) and Chrome (Mac, Linux).

Important
Chrome in Windows has some restrictions about installing extensions that are not from the Chrome Store. If Chrome blocks you from installing InTools in Windows, you must install the unpacked extension in developer mode. See Chrome (Windows) for installation instructions.

Start

  1. Run the Chrome browser.
  2. Navigate to the chrome://extensions page.
  3. Open a window in your OS and navigate to the GWE_installation\tools\intools\extension\ directory.
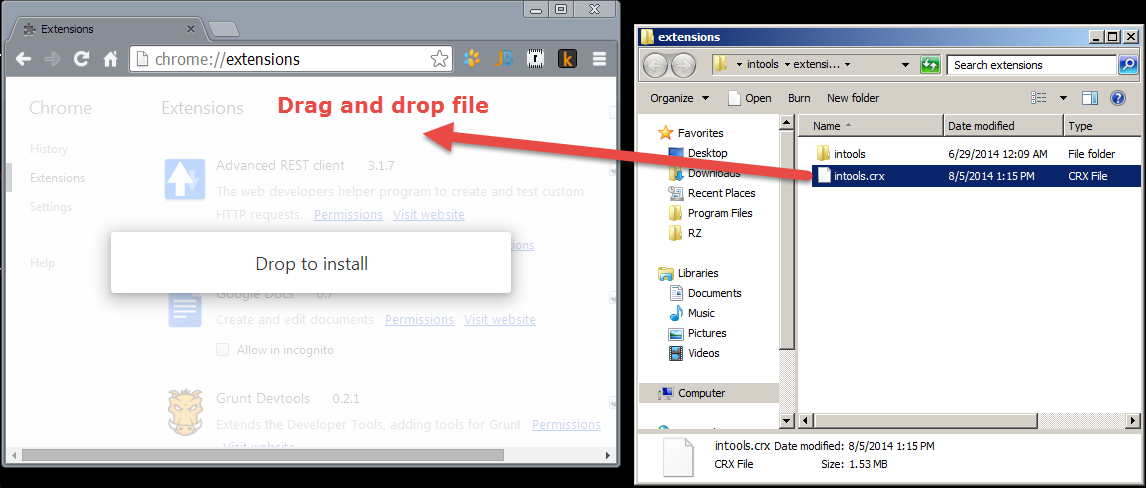
  4. Drag and drop the intools.crx file to the browser.

    GWE-drag-drop.png
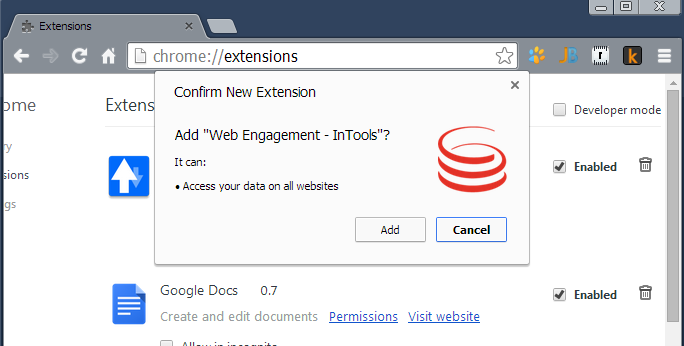
  5. In the Confirm New Extension dialog, click Add.

    GWE-confirm-extension.png

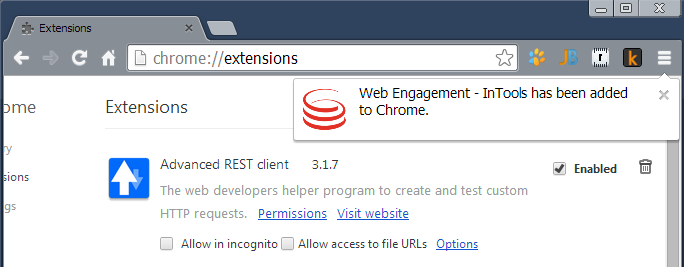
    The InTools extension is added to the extension list and enabled:

    GWE-intools-enabled.png
    .

End

Chrome (Windows)

  1. Run the Chrome browser.
  2. Navigate to the chrome://extensions page.
  3. Enable Developer Mode.

    GWE-developer-mode.png
  4. Open a window in your OS and navigate to the GWE_installation\tools\intools\extension\ directory.
  5. Unpack intools.crx by using a zip archiver.
  6. Click Load unpacked extension... and choose the directory with InTools that you unpacked in the previous step.

    GWE-unpack-intools.png

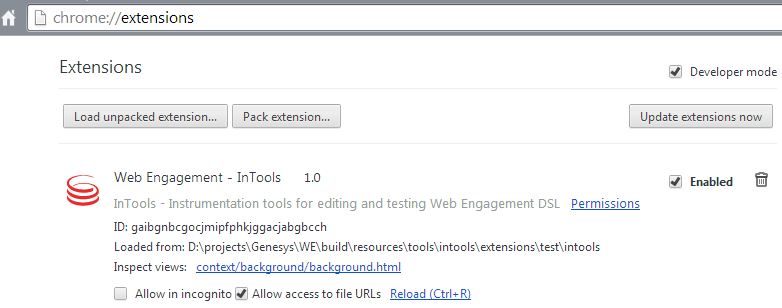
    The InTools extension is added to the extension list and enabled:

    GWE-win-intools-enabled.png

GWE DSL Editor

The DSL Editor allows you to create, edit, and test Genesys Web Engagement DSL.

The DSL Editor

Advanced Editor

The Advanced Editor is a text editor for Genesys Web Engagement DSL that provides the following features:

Feature Usage
Syntax highlighting. The editor highlights reserved words to improve readability. Automatic.
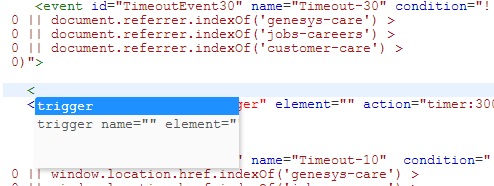
Code complete. The editor provides a code complete menu so you can see options to auto-complete your code. Use ctrl+space to open the window.
The code complete menu.
XML syntax validation. Automatic.
Syntax validation
jQuery selector highlighting. The tool can generate values for underscored attributes ("element" and "value") by clicking HTML elements on the page.
Selector highlighting
DSL structure validation. The tool validates the names and positions of elements, including children. Click GWE-validate-button.png.

An example of DSL validation
Load the current DSL from a page. You can navigate to an already instrumented page and load DSL from it. Click GWE-DSL-load.png.
Pretty formatting. Click GWE-formatting.png.
Test DSL. You can publish DSL changes to the current page Click GWE-test-dsl.png. The page is restarted and configured with the new DSL.
Unpublish DSL. You can removed the DSL you published. Click GWE-unpublish-DSL.png.
Save as. You can save your DSL changes to the file system. Click GWE-save-as.png.

Simple Editor

The Simple Editor is a wrap for the Advanced Editor that provides easy to use forms.

The Simple Editor

The editor includes the following features:

Feature Usage
Navigation tree. The navigation tree allows you to quickly see events, triggers, and values. Automatic.
jQuery selector highlighting. As in advanced mode, the tool can generate values for underscored attributes ("element" and "value"). Click the magnifying glass GWE-magnifying-glass.png.
Create or remove elements in the DSL tree. Click GWE-add-remove-dsl.png
Test DSL. You can publish DSL changes to the current page Click GWE-test-dsl.png. The page is restarted and configured with the new DSL.
Unpublish DSL. You can removed the DSL you published. Click GWE-unpublish-DSL.png.
Save as. You can save your DSL changes to the file system. Click GWE-save-as.png.

Event Console

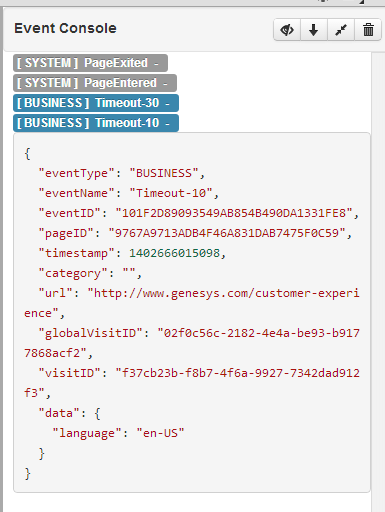
The Event Console monitors the generated events (both system and business). The event body includes all the event data in JSON format. The same format is posted to the Frontend Server.

The Event Console

The Event Console includes the following features:

Feature Usage
Generated events monitoring. Automatic
Toggle the full information for an event. Click the event name to hide/show the event information.
The full event information is displayed.
The full event information is hidden.
Hide all system events. Click GWE-hide-system.png.
Auto scroll to the last generated event. Toggle GWE-auto-scroll.png to enable.
Toggle all events. Click GWE-toggle.png.
This page was last edited on January 5, 2015, at 14:49.
Comments or questions about this documentation? Contact us for support!