Web Traffic Today Extended View
Here is the dashboard you will see if you expand the Web Traffic Today widget:
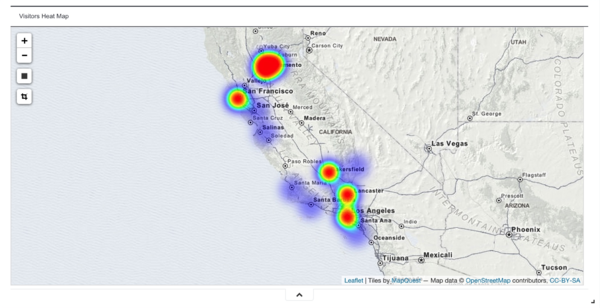
This view includes a heat map that displays important information about the locations of your visitors, using the time frame established by the time filter. Note: By default Web Engagement does not collect visitor IP addresses. If you want to analyze this data, you must have your system administrator turn this feature on explicitly.
The heat map shows areas with the greatest number of visitors in red, while locations with smaller numbers of visitors are indicated in purple.
Note that the heat map also has resizing and cropping tools:
You can also see the Top 5 websites your visitors have arrived from within the given time frame:
The Top 5 domains they have landed on:
The Top 5 languages your visitors have been using:
As well as which browsers they are using:
And how many mobile users and desktop-based users have visited the site since midnight:
The number of mobile users is calculated on the basis of browser-side data stored in the userAgent property. The desktop total is the number of users who were not using a mobile device. For more information about the relevant visitor data, refer to the article on Event Structure.
You can even filter the heat map by Top 5 Origins or by Top 5 Languages. This image shows geolocation results filtered down to people who arrived from "google.com" and are using Mexican Spanish:
Website Traffic
This dashboard also includes a layered timeline graph that displays how many visitors have come to your site and how many pages they have viewed, using the time frame established by the time filter.


