Contents
Understanding Alerts
Frontline Advisor provides a lot of information about the performance of your agent teams. It is important to learn to read the various alerts that can appear in your dashboard; they are the key to understanding where you need to provide guidance.
If you see only numbers with a white background in your dashboard, and no exclamation marks display anywhere in the Hierarchy and Team panes, then congratulations! Things are going well and agents are performing as expected.
If you see exclamation marks and red or yellow backgrounds associated with numbers, then you are experiencing alerts that should be monitored closely.
There are two types of alerts:
You might be responsible for configuring the rules and thresholds for your teams, or a system administrator might do it for you.
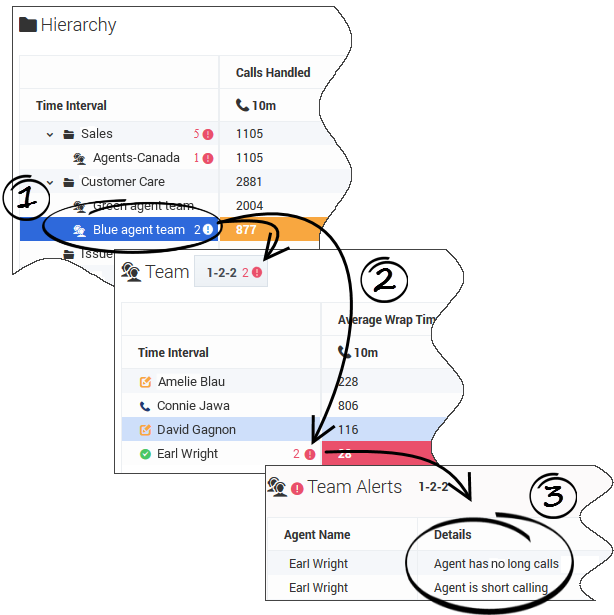
Rule-related alerts display within the list of group names in the Hierarchy pane and within the list of agent names in the Team pane, rather than in the table cells.
Rules are conditions that continuously monitor agent performance (rules evaluate and trigger on agent performance, not on team performance).
A rule can be based on the frequency of calls held or calls transferred, or on the frequency of long or short call duration or wrap time. For example, the following rule tracks short calling:
Set of agents has > 50 Calls Handled which are < 20 seconds in the last 20 minutes.
Description: Agent is short calling.
Once a rule violation occurs, an alert is generated. The rule-related alert icon is always red. It is good practice to act on this type of alert quickly – before agents develop bad habits.
The frequency of an alert is an indicator of desirable or undesirable trends. Ideally, the number of rule alerts should be low: one or two per agent per day. If your role includes the permission to configure rules, then use rules to improve the performance of your teams. Genesys recommends that you set rules to monitor only one or two scenarios each week. Stay focused on the performance areas that require the most improvement. In future weeks, you can update the rules to tighten the triggering numbers or, once agents are performing well in those areas, you can define new rules to monitor completely different aspects of performance. Using rules in this way, you gradually improve the overall performance of teams.
An alert becomes inactive, and is archived in a database (that is, it is removed from the dashboard), once the agent keeps his or her behavior corrected for the time period defined in the rule (for example, 20 minutes). Any alert that becomes inactive while Frontline Advisor is offline (for example, during maintenance cycles) will be archived at system startup.
Trace rule alerts to specific agents
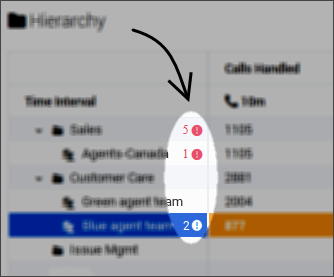
In the Hierarchy pane, you might see rule alert summaries for groups or teams, such as those pictured in the figure. The number beside the exclamation mark indicates how many rule violations are currently active for the group or agent team.
Thresholds define the critical, warning, and acceptable conditions for each metric for one or all time profiles. You, or another administrator or supervisor in your contact center, can specify an acceptable value or range of values for each metric. When an agent consistently fails to stay within that range of values, this type of alert is triggered.
The color of an alert is meaningful:
- The yellow-colored alert is a warning that the agent's activity, tracked by the metric that is displaying the alert, does not quite meet expectations.
- The red-colored alert is a critical alert. You should try to correct the activity associated with this alert as soon as possible.
Threshold Settings
Threshold definitions are based on metrics. A threshold setting can be:
- Based on a count
- Based on an average or maximum time value
- Based on the duration of an agent’s state
Threshold definitions typically have both upper and lower limits. For example, the following threshold configuration tracks the acceptable number of calls handled in a specific time interval:
Time Profile: 10 minutes
Calls Handled:
- In the specified time profile, handling 3 to 4 calls generates a warning alert.
- In the specified time profile, handling 8 to 10 calls generates a warning alert.
- In the specified time profile, handling less than 3 or more than 10 calls generates a critical alert.
- In the specified time profile, handling 5, 6, or 7 calls is acceptable.
Threshold violations are cleared as soon as the agent logs off.
Warning and Critical Threshold Alerts
If you see numbers with a yellow background or outline, then you need to watch those numbers closely and see how they trend. This type of alert is a warning, and it lets you know that an agent's performance is slipping. You might coach the agent at this point, or you might wait and see if the performance improves.
If you see numbers with a red background or outline, then you need to pay close attention – this is a critical alert. It could be a short-lived event, or it might be an indication that some aspect of the agent's performance (identified by the metric with which the alert is associated) has become unacceptable. It is important to coach the agent as soon as possible.
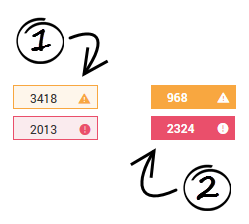
Threshold alerts display as either an outlined table cell (1) or as a solid-colored table cell (2):
- An outlined table cell indicates that there is at least one threshold violation for at least one agent (or object) within the associated aggregation group. (Frontline Advisor does not capture team performance metrics; rather, it indicates team performance by aggregating the metric values of the member agents.) If you see an outlined table cell in the Hierarchy pane, you need to drill down to the agent level, if possible, to find the actual violation.
- A solid-colored table cell indicates that the associated agent (or object) has violated the threshold settings and triggered the alert.
The color of the alert that displays in the Hierarchy pane is dependent on the color of the alert in the Team pane:
- The threshold violation colors in the Team pane determine the threshold violation colors in the Hierarchy pane. For example, if all of the threshold violations for a metric in the Team pane are yellow, then the threshold violation color for the metric for the affected group in the Hierarchy pane is also yellow.
- If only one threshold violation for a metric in the Team pane is red, and any other threshold violations for the metric are yellow, then the violation color for the metric for the affected group in the Hierarchy pane is red. In other words, the highest priority violation determines the color of the alert in the Hierarchy pane.
A red violation in the Hierarchy pane might appear misleading when the values are generally in the yellow range of the threshold rule, but the color is displayed to call attention to the violations on the team. If you see the red threshold alert at the group level, it does not indicate that the violation was triggered at that level, but means that you should do root cause analysis by drilling down to the team level to find the actual violation.


