enable-config
Section: features
Default Value: false
Valid Values: true, false
Changes Take Effect: Immediately
Introduced: 8.5.200.07
If true, enables the new Monitor UI.
enable-metrics
Section: features
Default Value: false
Valid Values: true, false
Changes Take Effect: Immediately
Introduced: 8.5.200.07
If true, enables the new Monitor > Metrics tab of the Service Management UI.
enable-downloaddfm
Section: features
Default Value: false
Valid Values: true, false
Changes Take Effect: Immediately
Introduced: 8.5.200.07
If true, enables the Tools > Download Dfm item in the Service Management UI.
enable-patterns
Section: features
Default Value: false
Valid Values: true, false
Changes Take Effect: Immediately
Introduced: 8.5.200.07
If true, enables the new Tools > Patterns panel in the Service Management UI.
enable-resources
Section: features
Default Value: false
Valid Values: true, false
Changes Take Effect: Immediately
If true, enables the new Tools > Resources panel in the Service Management UI.
Tools tab
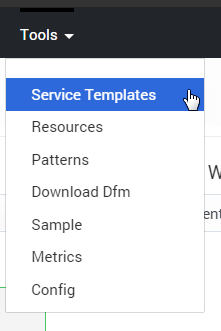
The content of the Services and Tools > Tools menu depends on the options configured in the features section.
Service Templates
The Tools > Service Templates panel illustrates how to import service templates. See Service Templates for details.
Resources
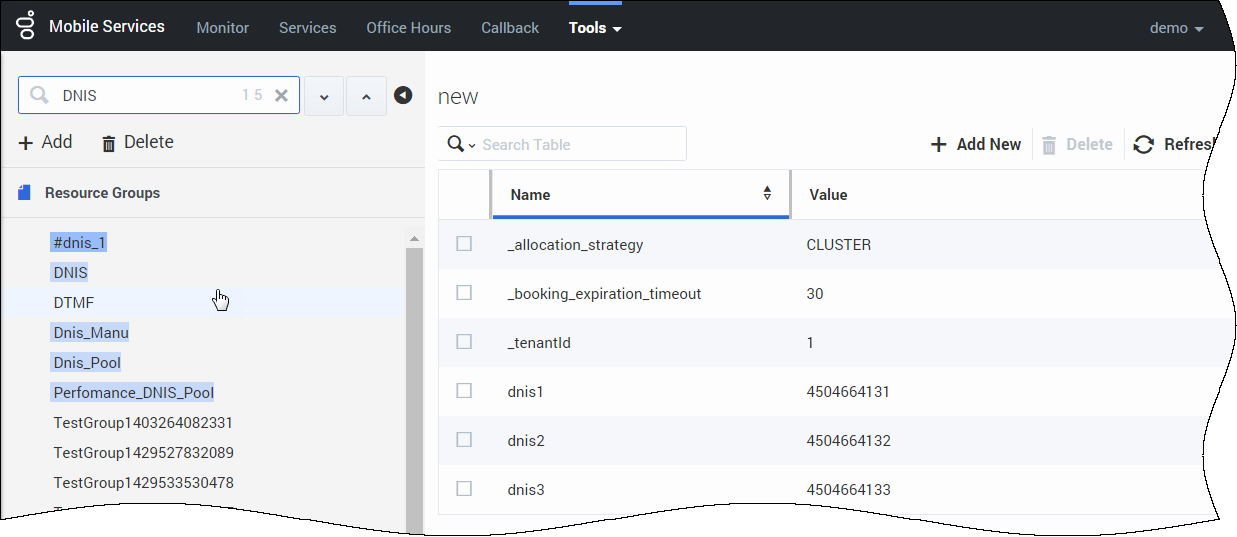
To enable resources in the Service Management UI, configure enable-resources = true in your GMS configuration.
The Resources tab enables you to create new resource groups and add resources. It provides the same functionality as Resources (Configuration Database Objects) in Configuration Manager, as well as displaying available and total resources.
Patterns
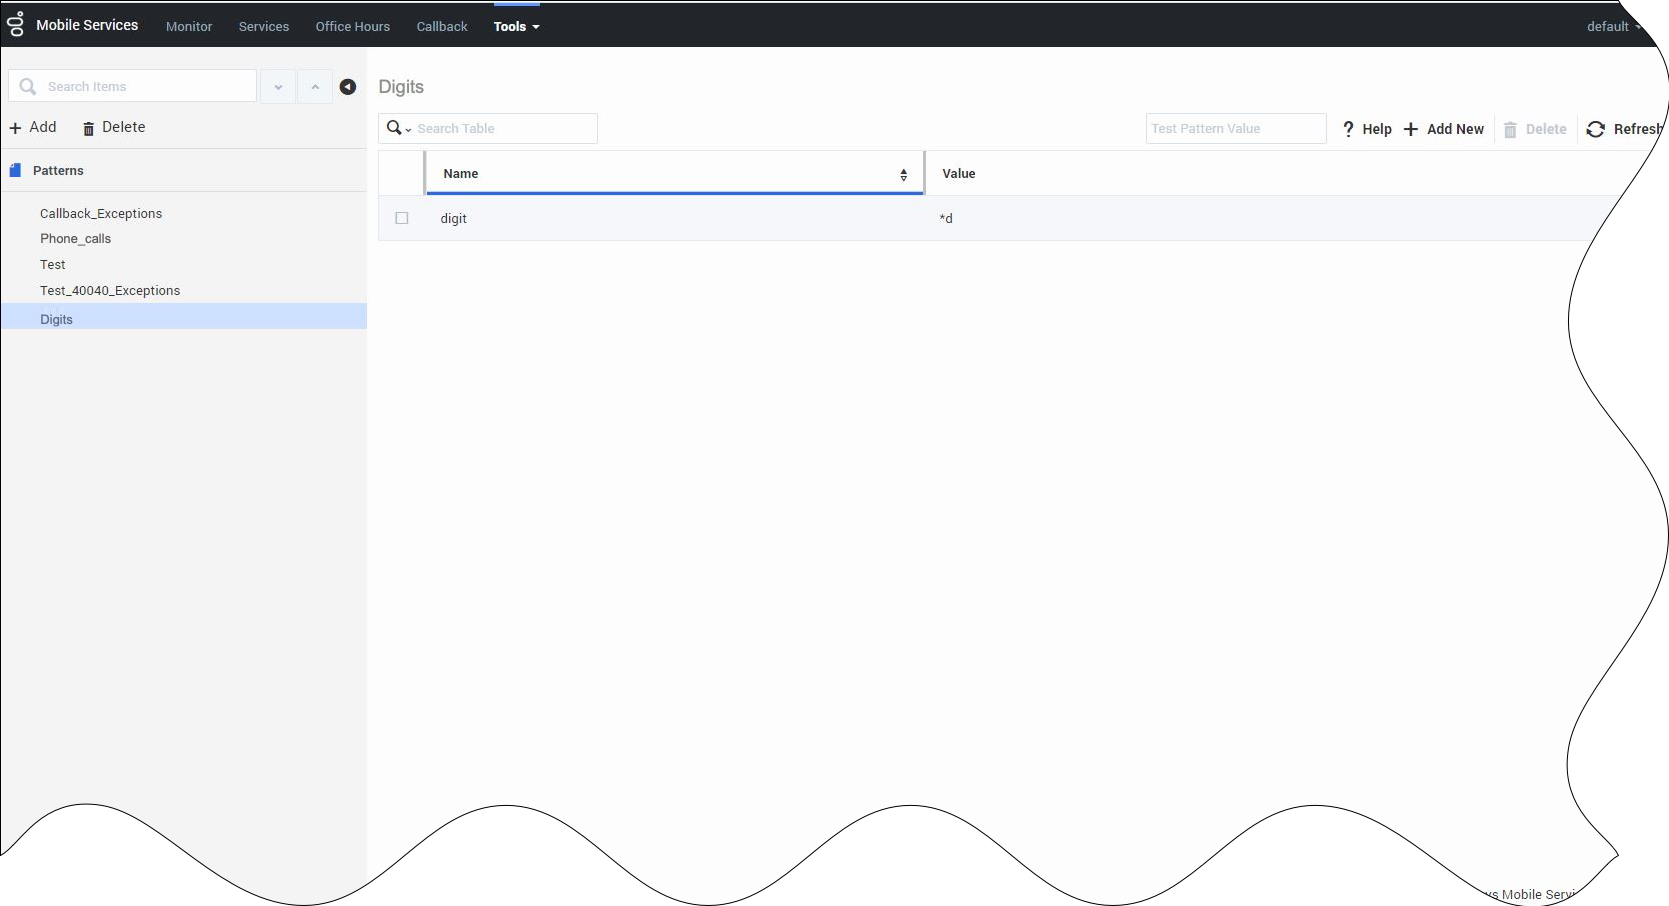
To enable patterns in the Service Management UI, configure enable-patterns = true in your GMS configuration.
The Patterns tab enables you to configure groups of exceptions; for example, phone numbers. The Help button displays the format for the expressions. Once you have defined some patterns, use the Pattern Matcher API queries to check the validity of your parameters. In the patterns group, you can test the value of a pattern against an entire group. Type a value in the input field, and if a match is found, the corresponding table row will be highlighted.
Download DFMs
To enable DFMs in the Service Management UI, configure enable-downloaddfm = true in your GMS configuration.
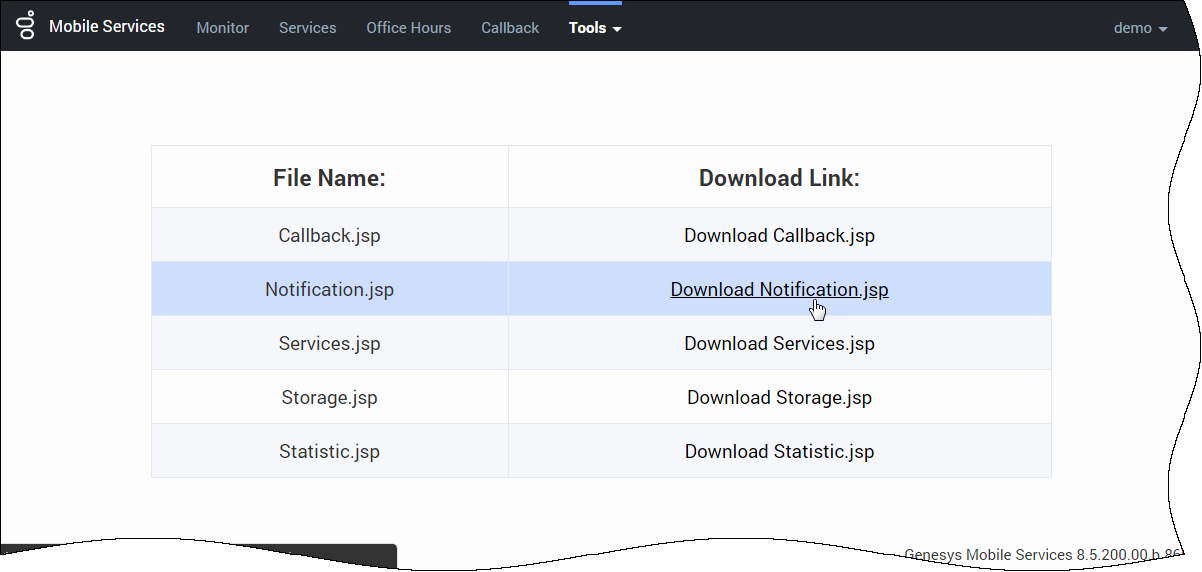
The Tools > Download Dfm panel enables you to download special configuration files, called DFM.
- DFM files define Genesys Mobile Services-specific SCXML that are required for Orchestration Server-based services.
- You must deploy these files in your Orchestration Server application if you need to execute SCXML applications used within Orchestration Server-based Services.
Click one of the DFM file links and the download will start.
Sample
The Tools > Sample panel illustrates how to implement a Desktop/Mobile browser web application that communicates with GMS and performs supported contact scenarios. It is primarily meant to be used by developers as a reference to build a Javascript-based web application with GMS. See Sample for details.
Metrics
To enable Metrics in the Service Management UI (known as Reporting in the former UI), configure enable-metrics = true in your GMS configuration.
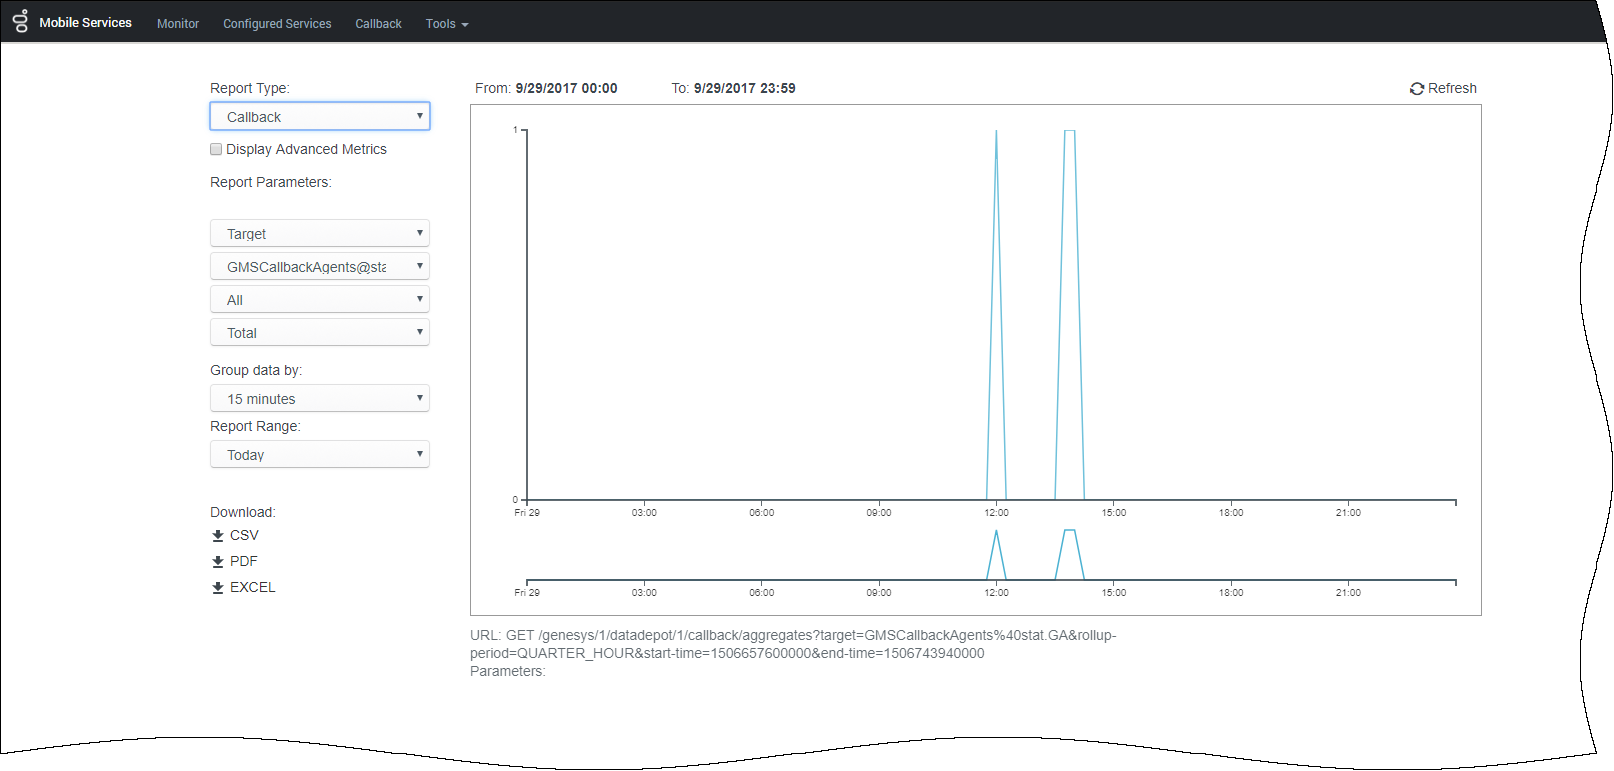
The Tools > Metrics panel is a dashboard that displays current resource and service utilization. You can select pre-defined date and time ranges, and export the reports into CSV, PDF, or Excel file formats. You also have the ability to zoom into a selected area of the graph to view additional details.
Four types of reports are available:
- Resources - Displays the usage history of the selected Resource group. Note: These are the Resource groups that were defined in the Tools menu.
- Services - Displays the aggregated total a service was accessed for a given time period.
- Callback - Displays Callback services data, if the Callback services are active.
- Display Advanced Metrics - When this option is selected, you can choose between a metric type of Holdtime or Watermark.
- Holdtime - You can set parameters for displaying the HoldTime statistics (media type, rollup-range, and time range).
- Watermark - For Callbacks in the QUEUED state, you can display high, low, and average watermarks (AVG, MIN, MAX) over time periods of 15 minutes, 30 minutes, an hour, or a day. Note that the Watermark is computed every minute, so for example, running 20 Callbacks simultaneously within a one-minute period, then none for the rest of the same 15-minute period, will result in Min=0, Max=20, and Avg=1.
- Display Advanced Metrics - When this option is selected, you can choose between a metric type of Holdtime or Watermark.
- Operational metrics - DNIS pool usage and availability.
- DNA availability by pool – Determines, in real time, the number of outstanding service requests (or available resources) by resource pool.
- Average Handle Time (AHT) by resource pool – Reports historical AHT, in seconds, by resource pool summarized by 15 minutes, 30 minutes, an hour, a day, or over a range of periods such as today, yesterday, last week, last month, or a range of dates. Timeouts do not impact the calculation.
- Service Exiting Reporting — Reports on historical service terminations (match or timeout) by resource pool summarized by 15 minutes, 30 minutes, an hour, a day, or over a range of periods such as today, yesterday, last week, last month, or a range of dates.
Config: Jetty XML Snippet
To enable Config in the Service Management UI, configure enable-config = true
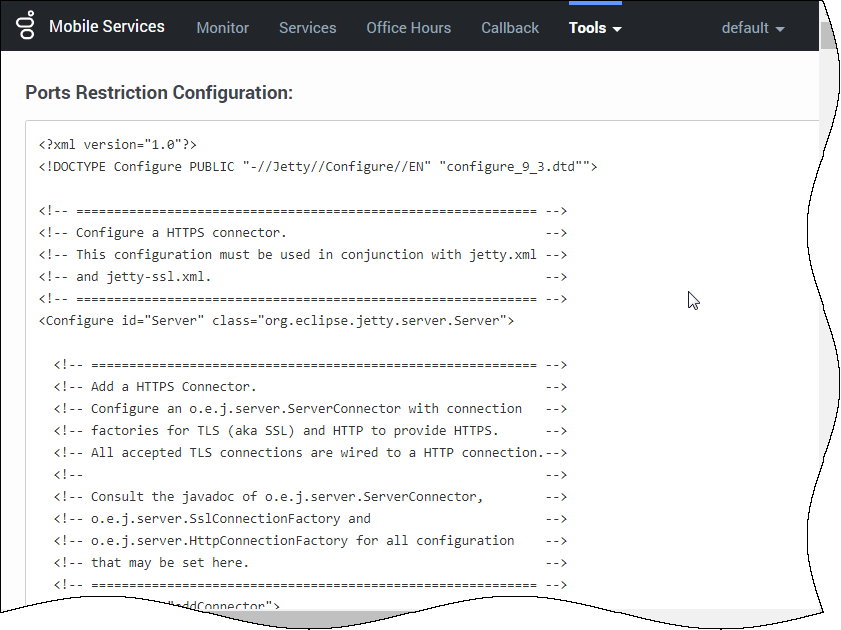
The Config tab provides you with a code snippet that you must add to the jetty-http.xml file for port number control. The code snippet is available when port restrictions have been enabled in your GMS Configuration. See Restricting Ports for more information about using this feature.
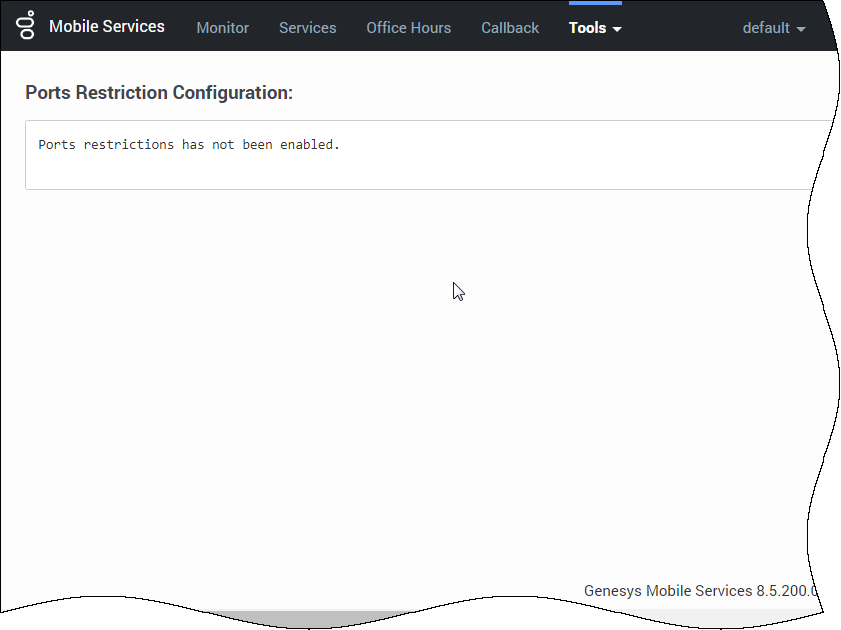
By default, restrictions are disabled and the Config Tab displays a default message.
[+] See default message
