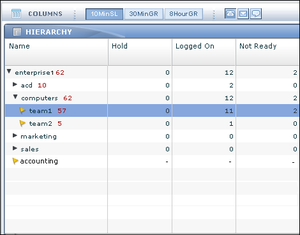
An administrator specifies how often state and performance metrics roll up to the hierarchy pane in the FA manager dashboard; this is the rollup cycle. The Frontline Advisor service generates metrics values at the beginning of each rollup cycle. After the initial load of the hierarchy at startup, FA subscribes to change events for folders and agent groups. When FA receives an event notification for an object currently in its hierarchy, the FA service updates the monitoring hierarchy to reflect the change. See FA Dynamic Hierarchy for more information.
FA Monitoring Hierarchy
Contents
- 1 FA Monitoring Hierarchy
- 1.1 Defining a Monitoring Hierarchy
- 1.2 Reading the Sample Hierarchy
- 1.3 Where is the Hierarchy Stored?
- 1.4 Who Configures the Hierarchy?
- 1.5 When is the Hierarchy Configured?
- 1.6 How do Folders in Configuration Server become the FA Hierarchy?
- 1.7 Can I View Agent Skills in the Monitoring Hierarchy?
The monitoring hierarchy, used in Genesys Frontline Advisor supervisor dashboard, is a representation of your enterprise and the members of that enterprise who participate in customer interactions. The hierarchy tracks groups of people. The monitoring hierarchy is the foundation of everything you do in Frontline Advisor; supervisors and other managers use the hierarchy to track and manage performance levels.
Defining a Monitoring Hierarchy
A sample monitoring hierarchy is used here to explain how to define the data representing a hierarchy. When you define your monitoring hierarchy, use this example to guide you.
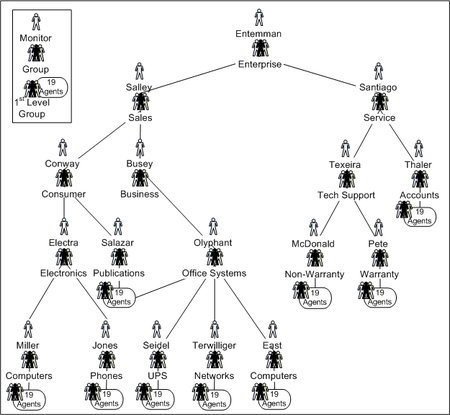
The monitoring hierarchy defines how agents are grouped, how groups are grouped, and so on, until there is just one all-encompassing group at the top. The following graphic shows a sample monitoring hierarchy.
Genesys recommends that you produce a similar graphic of your hierarchy. Some hierarchies may be so large that this is not possible, but you should do it if you can. A graphic allows you to see the groups and monitors, as well as to annotate the nodes with database IDs and other details that make working with your hierarchy simpler and less prone to error.
Reading the Sample Hierarchy
The sample monitoring hierarchy has nine first-level groups, each with nineteen agents. It is common in contact centers to refer to the first-level groups as groups or nodes. On the dashboard, they are called teams.
The nine first-level groups in the sample hierarchy are:
- Computers
- Phones
- UPS
- Networks
- Computers
- Publications/Office Systems
- Non-Warranty
- Warranty
- Accounts
Note that groups are allowed to have the same name (for example, two groups named Computers), provided that they do not share the same parent.
These nine groups appear at various levels in the hierarchy. This is an important concept: groups do not all have to be at the same level of the hierarchy. For instance, the Phones group is two levels below the Accounts group.
The sample monitoring hierarchy has more groups above the first-level groups. Computers and Phones are in the Electronics group. UPS, Networks, and the second Computers group are in the Office Systems group. Groups within groups continue up the hierarchy (also called a tree), until the root node. The root node of the sample monitoring hierarchy is the Enterprise group.
The hierarchy also defines the monitors. A monitor is a person who has access to – and can monitor – a specific group in the hierarchy. For simplicity, the sample monitoring hierarchy defines only one monitor for each group. The person named Entemman monitors the Enterprise group, the person named Salley monitors the Sales group, the person named Electra monitors the Electronics group, and so on throughout the tree, with one person monitor for each group. Note that the person with the last name Conway is a monitor of the Consumer node. This implies that Conway can monitor all of the groups in the Consumer subtree, as well, which consist of the 19 agents on the Computers group, the 19 agents on the Phones group, and the 19 agents on the Publications group.
Once you understand the monitoring hierarchy in your enterprise, you must configure it in Genesys Administrator for use in Frontline Advisor.
Where is the Hierarchy Stored?
Monitoring hierarchies are created and maintained in the Genesys Configuration Server by administrators with the required roles and permissions.
If you are a new Genesys customer, then hierarchies can be imported directly from a third-party system or HR system by Genesys Professional Services consultants as part of an initial deployment, and then maintained in the Genesys environment.
Who Configures the Hierarchy?
An administrator in your enterprise can configure which location or folder in the Configuration Server houses the hierarchy, and multiple folders can be chosen if the hierarchy is spread over many different folders or tenants.
When is the Hierarchy Configured?
An administrator must configure the hierarchy before FA is launched and used by managers in your enterprise. The hierarchy is the foundation of Frontline Advisor.
How do Folders in Configuration Server become the FA Hierarchy?
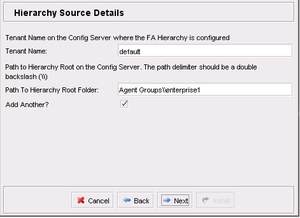
During installation, you specify the root for the FA hierarchy. Hierarchy root nodes are specified by providing a tenant name and a path to the folder that is the root. This folder can be under the Agent Groups configuration unit or Persons configuration unit in Genesys Configuration Server.
This means that the hierarchy views that are specific to a supervisor can be created; the supervisor can see only their own team’s hierarchy. This also provides the opportunity to enforce uniqueness of names at the level of sibling hierarchy nodes. This in turn means that it is possible to have nodes with the same name (for example, Sales) provided they do not have the same parent.
It is possible to have multiple root nodes in the hierarchy, which can come from different tenants. A root level node is no longer automatically called Enterprise. Your enterprise can call them anything that is permitted in Genesys Administrator.
Folders and agent groups in the Genesys Configuration Server translate to groups in the FA hierarchy. Folders and agent groups created in the Configuration Server have a tree structure in which a folder can have multiple sub-folders or agent groups.
The agent groups contain agents. The agents present in agent groups in Configuration Server represent agents in the FA hierarchy. Groups and agents replace the terms supervisors, teams, and agents from previous releases.
An agent can be a member of more than one group if the hierarchy is imported from Configuration Server.
When the FA service is started, the monitoring hierarchy defined in Genesys Configuration Server is loaded. If multiple folders in Configuration Server comprise the FA hierarchy, then FA creates a consolidated view of the hierarchy with a virtual enterprise node linking all the various hierarchies together.
The hierarchy is also loaded daily at 02:55 a.m., or whenever you click the Hierarchy Reload button on the Settings tab of the FA administration page. Any subsequent changes to the hierarchy are reflected after the next rollup cycle, without waiting for the overnight reset or reloading the hierarchy manually.
Access permissions are configured at each node of the hierarchy according to user roles defined by administrators. These roles determine to which nodes of the hierarchy each manager has access. Supervisors and other managers no longer have automatic access to all child nodes of parent nodes to which they have access.
Supervisors can override rules and thresholds only for nodes to which they have Change access in Configuration Server. When a user logs in, a customized view of the hierarchy is created. This view contains only groups and agents to which the supervisor has Read access in Configuration Server. Managers may also be able to see nodes and their aggregations that are above those of their team(s), but require specific Change access to those higher-level nodes before they can edit them.
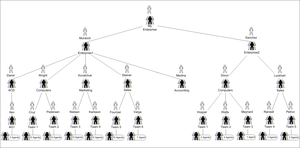
The following hierarchy is used in this example to show how a graphical representation of an enterprise is used to create the monitoring hierarchy in Frontline Advisor. Note that "My Enterprise" is not in the Configuration Server. It is a virtual, unnamed root node inserted by FA. It is not visible on the dashboard by any user.
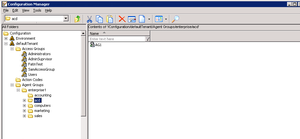
The following screenshot shows the folder structure that the system administrator configured in Configuration Manager.
The person in your enterprise who installs Frontline Advisor specifies the Enterprise and Enterprise Rollup folders as hierarchy root folders when deploying Frontline Advisor. The following screenshot shows the relevant installation screen.
The administrator grants permissions to a supervisor to view the groups and agents in those folders.
When the supervisor launches the FA dashboard for the first time, FA retrieves the Enterprise and EnterpriseRollup folders and subfolders from the Configuration Server. The following screenshot shows the hierarchy on the FA dashboard.
The following screenshot shows the hierarchy as it displays on the FA administration page.
The ExternalId.CISCO attribute must be set in the agent's Annex tab under the Advisors section, and the value of the ExternalId.CISCO will be the AgentSkillID for the agent in the Cisco environment.
The hierarchy extractor will first try to extract the skill ID from the Annex section for a Cisco configuration. If the ExternalID property is undefined in the Annex section, then it will extract the EmployeeID for the Genesys configuration.Can I View Agent Skills in the Monitoring Hierarchy?
35px|link= Starting in release 8.5.1, you can view agent skills and skill levels in the Frontline Advisor supervisor and agent dashboards. The Frontline Advisor server retrieves the list of skills and skill levels for each agent from the Configuration Server. The names of skills display in the Frontline Advisor and Agent Advisor dashboards exactly as an administrator entered them in Genesys Administrator.
In the FA supervisor dashboard, Agent Skills is a default column in the Team pane. You can hide the metric from display by removing the Agent Skills metric from the Selected Metrics pane in the Column Chooser.
See the following for more information:
- Team View for more information about using the Agent Skills metric in the Frontline Advisor dashboard, including how to filter the list of agents in the Team pane by agent skill.
- Using the Column Chooser to Select Metrics for information about using Column Chooser to hide or display metrics on the FA dashboard.
- FA Dynamic Hierarchy for detailed information about Frontline Advisor's hierarchy and how it works.
- State Metrics Displayed for Agents for information about the Agent Skills metric.

