View KPIs And Statistics
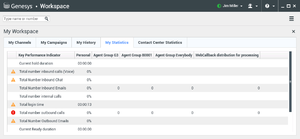
Workspace provides two views of performance: My Statistics and Contact Center Statistics. The My Statistics view lists your Key Performance Indicators (KPIs). The Contact Center Statistics view displays statistics about the Switches, Routing Points, queues, and other objects.
This lesson contains the following sections:
- Viewing Your KPIs
- Viewing Contact Center Statistics
- Viewing Statistics by Using the Statistics Gadget
Viewing Your KPIs
There are two ways to view the My Statistics view:
- From the My Statistics tab of the Main Window Workspace (see Lesson: Viewing your Key Performance Indicators (KPIs))
- From the Statistics Gadget (see Viewing Statistics by Using the Statistics Gadget)
The My Statistics view displays your KPIs. Your system administrator configures the KPIs that are displayed to you. The following columns of information are available for each KPI:
- Error/Warning Level—The error or warning level, if either is exceeded
- Key Performance Indicator—A description of the statistic
- Personal—Your value for the statistic
- <Agent Group Name>—The value for the statistic for the agent groups to which you belong.
Lesson: Viewing your Key Performance Indicators (KPIs)
Purpose: To determine if you are meeting the performance targets that have been set for you by your contact center.
The My Statistics tab displays your current KPIs and agent group KPIs. The My Statistics tab enables you to compare your performance with other members of your team. Warning and error icons are displayed to indicate which KPIs require your attention.
Prerequisites
- You are configured to view your KPIs.
- You are logged in to Workspace (see Lesson: Logging in to Workspace).
Start
- Click the Access and use Workspace supporting views button (
 ) to display the Supporting Views menu, then select My Statistics.
The list of your Key Performance Indicators (KPIs) is displayed (see the The My Statistics tab in the Main Window Workspace view figure). This view is updated constantly so that you can view your current statistics.
- You can perform the following functions in the My Statistics tab:
- Click column heads to change the sort order of the KPIs.
- Right-click the My Statistics tab to access the shortcut menu that enables you to do the following:
- Show or hide columns
- Show or hide KPIs
- Turn KPI filtering on or off to show only items that have warnings
- To close the Workspace view, click Workspace.
End
Viewing Contact Center Statistics
There are two ways to view the Contact Center Statistics view:
- From the Contact Center Statistics tab of the Main Window Workspace (see Lesson: Viewing statistics about contact center resources)
- From the Statistics Gadget (see Viewing Statistics by Using the Statistics Gadget)
The contact center Statistics view displays statistics that summarize the state of various conditions that are monitored by your contact center, such as the percentage of abandoned calls, the average call-waiting time, and the number of interactions in a queue. Your system administrator defines which statistics and objects are displayed to you. The following columns of information are available for each monitored object:
- Error/Warning Level—The error or warning level if either is exceeded
- Contact Center Resource—A description of the type of object, such as a queue or a Routing Point
- Description—A description of the statistic
- Value—The value of the statistic
Lesson: Viewing statistics about contact center resources
Purpose: To view statistics that summarize the states of various conditions that are monitored by your contact center, such as the percentage of abandoned calls, the average call-waiting time, and the number of interactions that are in a queue.
Prerequisites
- You are configured to view statistics for your contact center.
- You are logged in to Workspace (see Lesson: Logging in to Workspace).
Start
- Click the Access and use Workspace supporting views button (
 ) to display the Supporting Views menu, then select Contact Center Statistics.
The list of statistics about objects in your contact center is displayed (see the Main Window Workspace view Contact Center Statistics tab figure). This view is updated constantly so that you can view statistics from minute to minute.
Statistics about switches, Routing Points, queues, and other objects, are displayed in the Contact Center Statistics tab. You can drag column headings to change the order or the columns. Also, you can click a column heading to sort the objects based on the value of the column.
 - You can perform the following functions in the Contact Center Statistics tab:
- Click column heads to change the sort order of the statistics.
- Right-click the Contact Center Statistics tab to access the shortcut menu that enables you to do the following:
- Show or hide columns
- Show or hide statistics
- Turn statistics filtering on or off to show only items that have warnings
- To close the Workspace view, click Workspace.
End
Viewing Statistics by Using the Statistics Gadget
Statistics can be viewed either in the Main Window by selecting the My Statistics tab or the Contact Center Statistics tab in your Workspace, or by using the Statistics Gadget. The Statistics Gadget is a view of statistics that you can leave open all the time.
The Statistics Gadget displays statistics in two ways:
- In a statistics ticker
- In a Tagged Statistics view
The advantage of the Statistics Gadget is that you can view your KPIs and Contact Center Statistics continuously, without opening your Workspace and clicking back and forth between tabs.
Lesson: Viewing your KPIs and Contact Center Statistics continuously by using the Statistics Gadget
Purpose: To view your KPIs and Contact Center Statistics continuously without opening your Workspace and clicking back and forth between tabs.
Prerequisites
- You are configured to view your KPIs and/or you are configured to view statistics for your contact center.
- You are logged in to Workspace (see Lesson: Logging in to Workspace).
Start
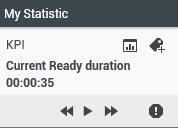
- To show the Statistics Gadget, select Show Statistics Gadget from the Main Menu in the Main Window. The Statistics Gadget is displayed (see the Workspace Statistics Gadget figure). The Statistics Gadget displays configured statistics in a ticking region. Each statistic is displayed for a specified period, then the next statistics is displayed.
- Use the buttons at the bottom of the Statistics Gadget to control the view (see the Workspace Statistics Gadget figure):
- To stop the ticker at a specific statistic, click the Stop button.
- To start the ticker, click the Play button.
- To view the next statistic, click the Forward button.
- To view the previous statistic; click the Back button.
- Warning and error icons are displayed if one or more statistics exceed or drop below threshold values that are configured by your administrator.
- Click a warning or error icon to scroll immediately to the next statistics that is in a warning or error state.
- The Statistics Gadget enables you to tag specific statistics in a static view that is displayed below the ticker.
- When a statistic is displayed in the ticker that you want to tag, click the Tag button:
 .
.
The Tagged Statistics view is displayed below the Statistics Gadget ticker view (see the Workspace Statistics Gadget Tagged Statistic view figure).
- When a statistic is displayed in the ticker that you want to tag, click the Tag button:
- You can tag more than one statistic at a time. The Tagged Statistics view expands to accommodate several statistics in a single view (see the Workspace Tagged Statistic View stack figure). The default maximum size of the Tagged Statistics view is five statistics; however, this value might be set to a different size by your administrator. If you have tagged more than the maximum number of stacked statistics, click the Up and Down arrow buttons at the bottom of the Tagged Statistics view stack to scroll up and down through your tagged statistics.
- To untag a statistic, click the Untag button:

- You can view your KPIs either as a graph or as text.
- Click the Graph View button to view the statistic as a graph:

- Click the Text View button to view the statistic as text:

- Click the Graph View button to view the statistic as a graph:
End


