Contents
Contact Center Dashboard
This page describes how you can use the Contact Center Dashboard to see detailed information about interaction volumes and KPIs for the whole contact center.
Note that the term 'dashboard' is used interchangeably with the term 'dossier’. Dashboards / dossiers provide an interactive, intuitive data visualization, summarizing key business indicators (KPIs). You can change how you view the data in most reports and dashboards by using interactive features such as selectors, grouping, widgets, and visualizations, and explore data using multiple paths, through text and data filtering, and layers of organization.
Understanding the Contact Center Dashboard
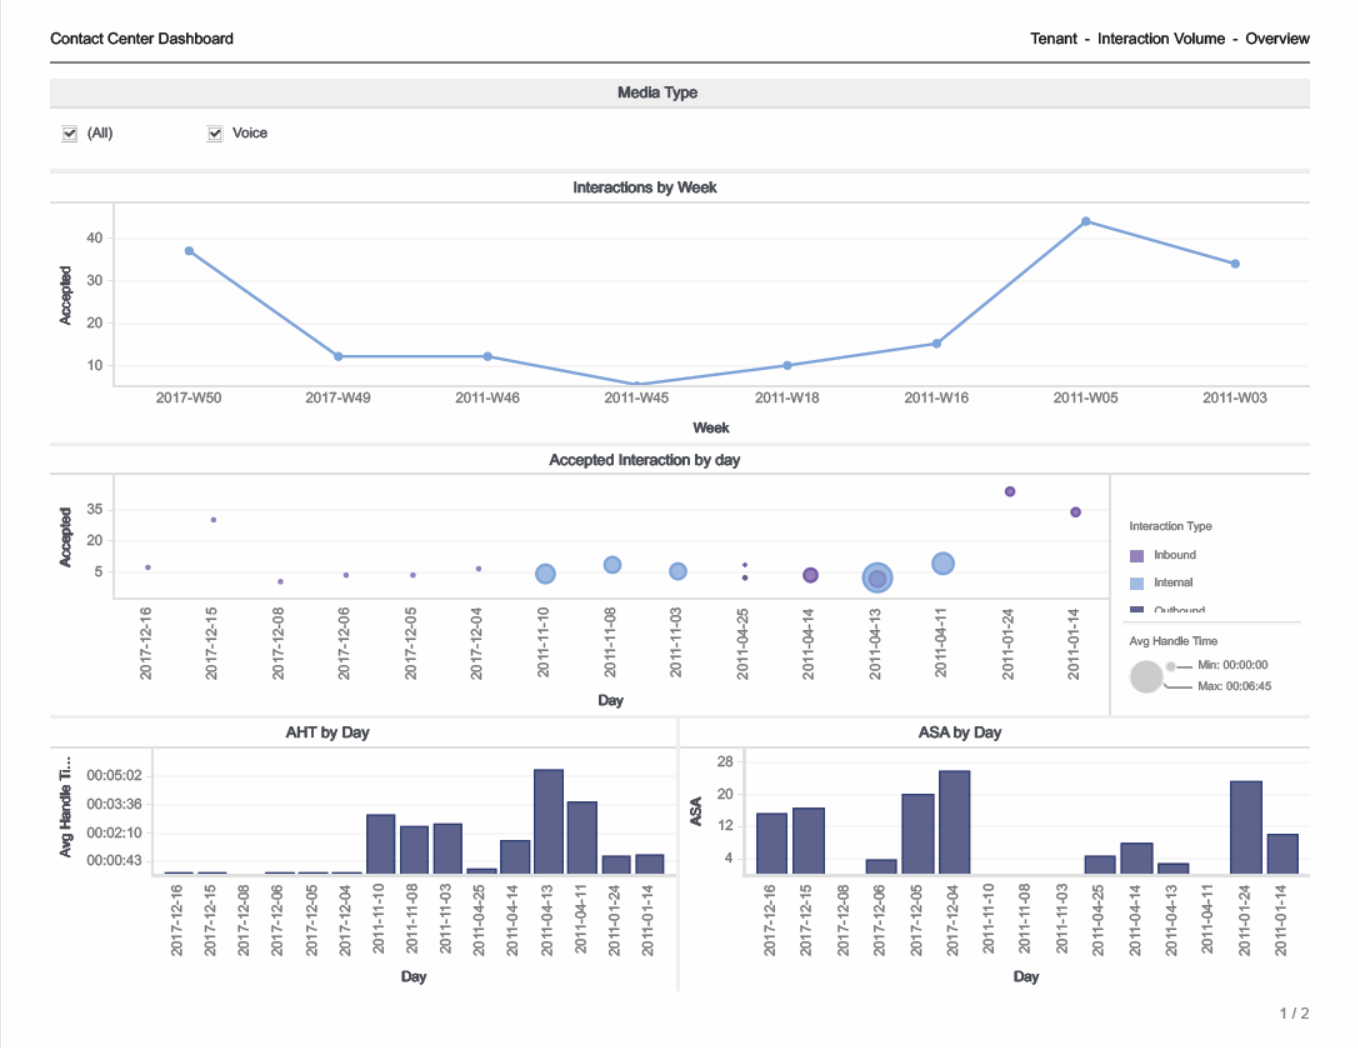
This dashboard is designed to provide an overview of the entire contact center by conveniently displaying key information about the volume of calls, interaction times, and handle times. The dashboard is divided into two tabs:
- Interaction Volume — This tab provides several views that illustrate the volume of interactions over time (by week), the volume of Accepted interactions each day, the Average Handle Time, and the Average Speed of Answer.
- Tenant KPIs — This tab provides a bar chart that contrasts the Interaction Time against the Average Handle Time, and displays various rates and averages, such as Speed of Answer, Engage Time, Response Time, Hold Time, Wrap Time, and Invite Time.
Use this dashboard to evaluate the overall performance and loading of the contact center.
To get a better idea of what this dashboard looks like, view sample output from the dashboard:
HRCXIContactCenterDashboard.pdf
The following tables explain the prompts you can select when you generate the dashboard, and the metrics that are represented in the dashboard:
Prompts for the Contact Center Dashboard
| Prompt | Description |
|---|---|
| Pre-set Date Filter | From the list, choose a time period on which to report, and move it to the Selected list. |
| Start Date | Choose the first day from which to gather report data. |
| End Date | Choose the last day from which to gather report data. |
Attributes used in the Contact Center Dashboard
| Attribute | Description |
|---|---|
| Business Result | This attribute enables data to be organized by the configured business result. |
| Customer Segment | This attribute enables data to be organized by the configured customer segment. |
| Day | This attribute enables data within the reporting interval to be organized by a particular day within a month and year. Day values are presented in YYYY-MM-DD format. |
| Interaction Subtype | This attribute enables data to be organized by the interaction’s subtype. |
| Interaction Type | This attribute enables data to be organized by the interaction’s type—for example, Inbound, Outbound, or Internal. |
| Media Type | This attribute enables data to be organized by the interaction’s media type—for example, Voice, Email, and Chat. |
| Service Subtype | This attribute enables data to be organized by the detailed type of service that the customer requested. |
| Service Type | This attribute enables data to be organized by the type of service that was assigned to the interaction. |
| Week | This attribute enables data within the reporting interval to be organized by week |
Metrics used in the Contact Center Dashboard
The Contact Center Dashboard is divided into two tabs:
- Interaction Volume
- Tenant KPIs
| Metric | Description |
|---|---|
| Handle Time | |
| Accepted | The number of customer interactions that were successfully transferred (warm or blind) to an agent. |
| Avg Handle Time (Fmt) | The average amount of time (HH:MM:SS) that agents spent handling each interaction. |
| Avg Speed of Answer | The average amount of time (HH:MM:SS) that customer interactions were queued and/or alerting or ringing before the interactions were accepted by the first-handling resource. |
| Conduct | |
| Interaction Time | The total portion of agent active time that the agents were busy processing interactions. |
| Avg Handle Time (Fmt) | The average amount of time (HH:MM:SS) that this agent spent handling interactions that the agent received.
This metric is computed as handle time divided by the sum of accepted interactions and received consultations. |
| Accepted | The number of customer interactions that were successfully transferred (warm or blind) to this agent. |
| % Abandoned Waiting | The percentage of customer interactions that were abandoned by the caller during the reporting interval. |
| % Transfer Initiated Agent | The percentage of accepted customer interactions that were transferred (warm or blind) by the agent. |
| Avg Speed of Answer | The average amount of time (HH:MM:SS) that customer interactions were queued and/or alerting or ringing before the interactions were accepted by the first-handling resource. |
| Avg Engage Time (Fmt) | The average amount of time (HH:MM:SS) that this agent was engaged with customers. |
| Avg Finish Response Time (Fmt) | The average duration of completed customer interactions that both had a response by a handling resource. This duration includes the entire lifespan of the interaction, including processing, queueing, and handling. |
| Avg Hold Time (Fmt) | The average amount of time (HH:MM:SS) that this agent had customer interactions on hold.
This metric is attributed to the interval in which interactions arrived at the agent (which can differ from the interval in which the interactions were placed on hold). |
| Avg Wrap Time (Fmt) | The average amount of time (HH:MM:SS) that this agent spent on customer interactions while in ACW (Wrap) state. |
| Avg Invite Time | The average amount of time (HH:MM:SS) that customer interactions alerted or rang at agent resources before the interactions were accepted, plus the average duration of dialing that agents performed, where the calls were successfully established. This metric is attributed to the interval in which the interactions began. |

