View Metrics with JMX
You can use JConsole to view metrics provided by your Web Engagement Server. To do this, you can start Web Engagement Server as a:
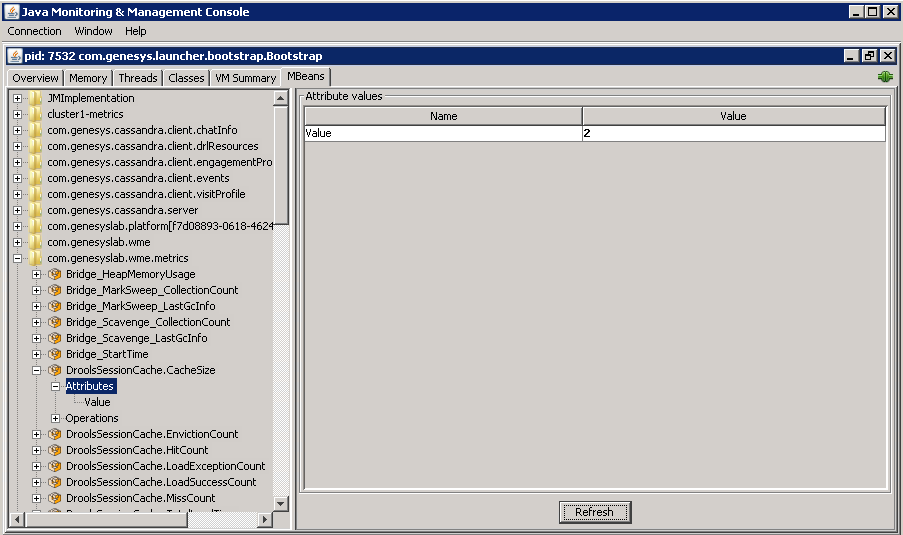
Once you have connected, you can view your metrics in a JConsole JMX panel.
You may also want to look into some of the other tools that are available for viewing your Web Engagement metrics.
Connect to Web Engagement started as a local java process.
- Run jconsole.exe from the jdk/bin directory.
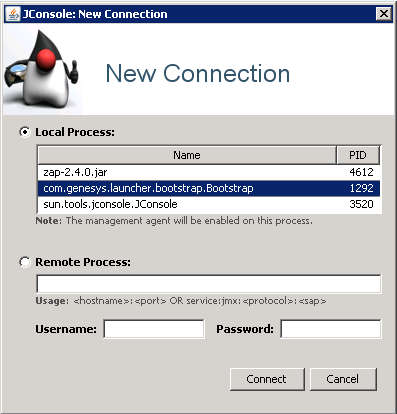
In the New Connection dialog, specify the Web Engagement launcher java process.
If the Web Engagement Server was started via a BAT file in the same host where the JMX console is opened, this launcher process is the com.genesys.launcher.bootstrap.Bootstrap process from the Local Process list.
Connect to Web Engagement Server started on a remote host.
If the Web Engagement Server was started remotely as a server, follow these steps:
- Run jconsole.exe from the jdk/bin directory.
- Open setenv.bat and uncomment all of the lines under the line that begins:
:: Uncomment for enabling JMX
- Save your changes.
- Restart the Web Engagement Server application.
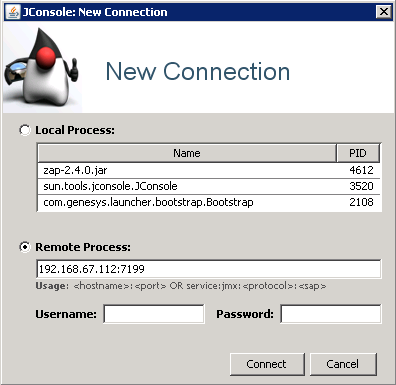
- Specify host:JMX port in the Remote Process section, as shown in the screenshot on the left.
Connect to Web Engagement started as a Windows service.
- Stop the service.
- Open setenv.bat and find the service name in the line that says SVC_NAME=.
- Run this command to remove the service:
server.bat -service <service name> remove
- Open setenv.bat and uncomment all of the lines under this one:
:: Uncomment for enabling JMX Remote. Memorize JMX port.
- Save your changes.
- Run this command to install the service:
server.bat -service <service name> install
- Start the service.
- Specify host:JMX port in the Remote Process section, as shown in the above screenshot.
Open the JMX panel to view the metrics.
- Click Connect in the New Connection dialog. The JMX panel opens.
- Open the MBeans tab and expand com.genesyslab.wme.metrics. All of the Web Engagement metrics are there.
- To refresh the metrics, click Refresh.
Other Tools
We have just explained how to use the JConsole tool bundled with Oracle Java (TM) to view your metrics, but there are several other tools you can use to do this:
- The EJTools JMX Browser
- Panoptes
- jManage
- MC4J
- Zabbix


