Debugging Routing Applications
Contents
- 1 Debugging Routing Applications
- 1.1 Starting a Debugging Session
- 1.2 ORS Debugger Limitations
- 1.3 ORS Debugging Perspective
- 1.4 Debugging a Workflow Diagram
- 1.5 Creating a Debug Launch Configuration
- 1.6 Stepping
- 1.7 Debugging-results Folder
- 1.8 Debugging SCXML Files
- 1.9 Creating a Run Launch Configuration
- 1.10 Debugging IPD SCXML Files
- 1.11 Stepping Through a Routing Application
- 1.12 Debugging Modes
Composer's ORS_Debugger provides real-time debugging capabilities for SCXML-based Orchestration Server (ORS) routing applications. The ORS Debugger is integrated within the workflow designer for making test calls, creating breakpoints, viewing call traces, stepping through an SCXML document/workflow, and debugging applications. Debugging can be started on an existing session or it can wait for the next session that runs the application at a given URL. Prior to debugging, set preferences for the ORS Debugger, which supports both Run and Debug modes.
- Using a Run As > Run Configurations launch configuration, metrics (call traces) are displayed and the application continues without stopping at any breakpoints. When the SCXML application executes, these metrics can describe, for example, state transitions, ECMAScript executions, and execution warnings or errors.
- Using a Debug launch configuration, debugging pauses at breakpoints, single-step through the code, inspect variable and property values, and execute any ECMAScript from the query console.
You can debug:
- A workflow built with Composer, or
- Any SCXML application or set of SCXML pages whether or not they were created with Composer.
Notes:
- You can export a launch configuration. From the File menu, select Export. Expand Run/Debug and select Launch Configurations > Next. The dialog box lets you select or browse for a launch configuration.
- Composer 8.1 uses TCP to send SIP messages (previous releases used UDP). This is not a configurable option.
- Also see ORS Debugger Limitations.
- For information on Debug Code Generation mode, see the figure in topic Project Properties dialog box.
Starting a Debugging Session
If using Context Services:
- Set Context Services parameters: Window > Preferences > Composer > Context Services. In Context Services Preferences, specify the Universal Contact Server host and port.
In order to debug, a launch configuration must exist. There are various ways to create a launch configuration:
- Right-click on the diagram/SCXML file in the Project Explorer. Select Run As > Run Configurations or Debug As > Debug Configurations. (The difference between Run as and Debug as is explained at the start of this topic.) This opens a dialog box for creating a launch configuration for the workflow diagram or SCXML files.
- Use launch shortcuts. Note: To automatically fill in a debug or run launch configuration, use launch shortcuts. Right-click on the diagram/file and select Debug As Workflow or Debug as SCXML File. Composer automatically fills in the launch configuration.
- On the main toolbar, there is a Debug
 button and a Run
  button. Clicking relaunches the most recently used launch configuration. You can also use the keyboard shortcuts Ctrl+F11 (for Run) and F11 (for Debug).
 - If you click the down arrow on these buttons to drop down a menu, a history of recent launches appears.
All of the above are also available in the Run top-level menu.
ORS Debugger Limitations
Limitations of the ORS Debugger are as follows:
- Do not use the ORS Debugger in a production environment. Use the ORS Debugger only for development purposes. A Production Orchestration Server is always configured to not allow debugging.
- Interaction process diagram debugging is not supported. Code generated from an IPD can be debugged just like any other SCXML page.
- In SCXML debugging mode, the <invoke> tag will not step into the invoked SCXML page. Debugging will continue to the next element in the page currently being debugged.
- Debugging a Play Application block will not step into the associated Callflow diagram and will not launch a GVP debugging sessions. Instead debugging will continue on to the block after the Play Application block.
- Application variables are not displayed correctly in the Variables View in ORS Debugging Perspective if the value contains XML or variables that are of type E4X.
ORS Debugging Perspective
See Debugging Toolbars for information on the views and buttons.

Debugging a Workflow Diagram
Workflow diagrams can be tested using the real-time ORS Debugger. Both Run and Debug launch configurations are supported, as well as code and diagram modes.
- In the Run mode, call traces are displayed and the workflow continues without stopping at any breakpoints.
- In the Debug mode, you can input breakpoints, single-step through the blocks, inspect variable and property values, and execute any ECMAScript from the query console.
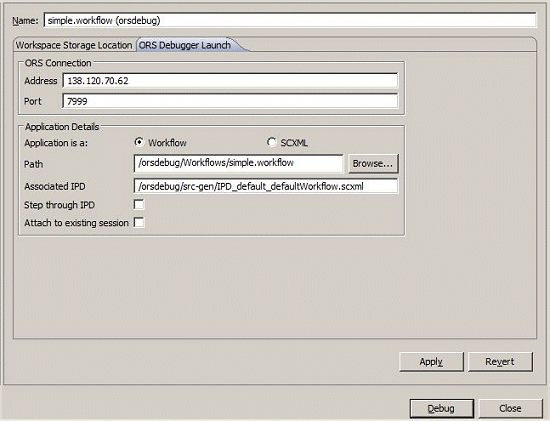
Prior to debugging, you should have validated the workflow, generated the code, and deployed the Project for testing. Also, if you have not already done so, set ORS Debugger preferences. To start debugging, create a launch configuration for the file you want to debug. An example launch configuration is shown below.
To automatically fill in the debug launch configuration described below, use launch shortcuts. Right-click on the workflow file and select Debug As Workflow. Composer automatically fills in the launch configuration.
Creating a Debug Launch Configuration
Note: See Debugging a SCXML Files if you want to view only call traces and not use breakpoints to step through the file. There are various ways to start a debug session. To test your workflow by stepping through it, use Debug Configurations to first create a launch configuration:
- In the Project Explorer, expand the Composer Project and its workflows subfolder.
- Right-click on the workflow filename in the Project Explorer and select Debug as > Debug Configurations. The Debug Configuration dialog box opens. Note: Debug As > Debug Configurations sometimes does not appear for selection. The exclusion may also occur in other Composer scenarios and is an Eclispe IDE-related behavior. Should this occur, the workaround is to restart Composer.
- Expand Composer - ORS Debugger.
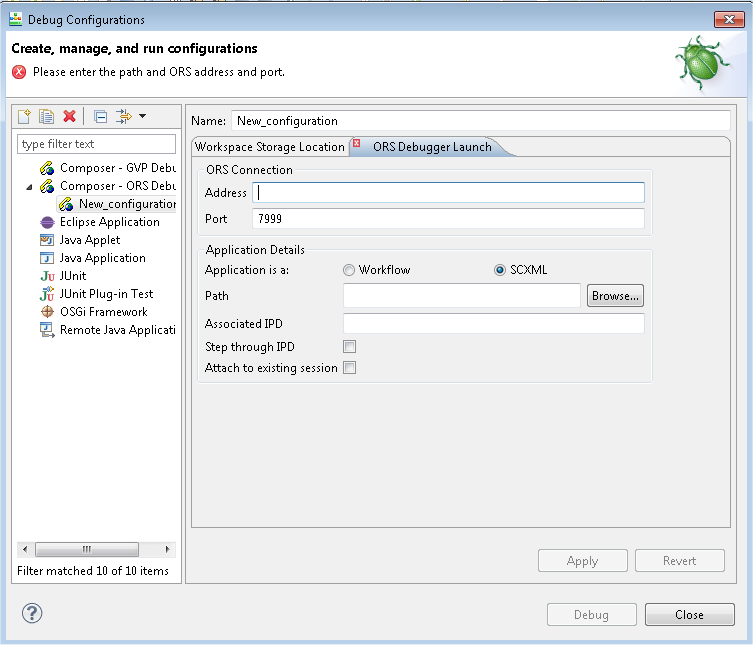
- Click the button for a new launch configuration or right-click and select New.
- Name the configuration.
- In the Workspace Storage Location tab, specify the Project name and location for saving SCXML pages executed by ORS. This folder appears in the Location field. Optionally, click Create Automatically to have the Debugger create a new Project folder to save the SCXML pages as the IPD is debugged. The files fetched may include SCXML pages, audio files, grammars, scripts, and SCXML data.
- Click the ORS Debugger Launch tab.

Note: Under ORS Connection, the IP Address and Port fields reflect the ORS Server Host Name and ORS Server Port previously entered as ORS Preferences, but can be changed.
- Address. Enter the IP address or host name of the ORS server.
- Port. Enter the debugger port of the ORS server. This is defined in ORS configuration as [scxml]:debug-port, and defaults to 7999. Make sure that ORS has debug-enabled set to true as well.
- Path. Enter the workspace-relative path of the workflow diagram. For example, /MyProject/src-gen/IPD_default_defaultWorkflow.scxml.
- Application is a. Select Workflow to step through the diagram or SCXML if code. If unchecked, it will step through the SCXML code.
- Associated IPD. Enter the name of the interaction process diagram (IPD) associated with the workflow to be debugged. This field is optional because it is possible to run a stand-alone SCXML. Most of the time, you will use launch shortcuts (right-click on workflow or SCXML and select Run/Debug As). The fields in the launch configurations are filled in automatically.
- Step through IPD. If enabled and debugging in code mode (as opposed to workflow mode), then the Debugger steps through the SCXML code that is generated from the IPD. Otherwise, it will "skip" through that code. The SCXML code generated from an IPD is generally setting up global variables and functions, so you might not want to go through that every time.
- Attach to existing session. If enabled, ORS will start debugging on an existing session. When you launch the debugging session, Composer will prompt for a session ID in a dialog box. Once you enter the session ID, it will enter debugging mode for that session. If not enabled, ORS will wait for the next session that runs the application at a given URL. Note: The URL will point to the SCXML page that should be debugged. ORS will enter debug mode for the next session that is started for this URL.
- Click Apply and Debug when ready.
After you launch, debugging doesn’t start until ORS starts the session. You can start the session with a SIP call or multimedia interaction or using the ORS REST API (you need to send a POST request to ORS). The ORS Debugger skips over deactivated blocks.
Note: If the debugging session can't be started, a dialog box appears with an error message.
Stepping
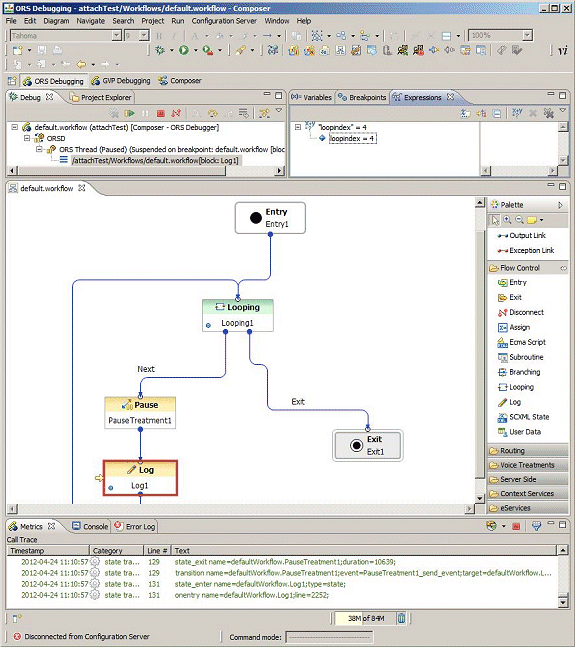
Once debugging is initiated you will see a red box around the first block of the workflow. This indicates the current location where debugging is paused.
- Step through the workflow. Click the Step Over
 button to step through the blocks. See Debug View. Application state can be seen in the Variables tab.
 - You can input breakpoints from the Breakpoints View/Toolbar or use the context menu on a block and select Toggle Breakpoint . When breakpoints are set, you can press F5 or click Resume to resume the call to the next breakpoint, instead of stepping block-by-block.
- You can change values of variables in the middle of a workflow. This could be used to quickly change the execution path as the call is progressing. Right-click in the Expressions tab and select Add Watch Expression.
- In the Add Watch Expression window, add a new expression to watch during debugging.
To change the value, expand the variable, right-click on the child item and select Change value. A popup window as shown above will open, and you can specify the new value. Click OK. Proceed with debugging of the application and see the changed value.
Debugging-results Folder
The ORS Debugger creates a debugging-results folder in the Project Explorer. Clean up the debugging results by deleting the ors-debug.<timestamp> folders from the Project Explorer. Each ors-debug.<timestamp> folder corresponds to a single debug call that was made at the time specified by the timestamp. It contains files downloaded by the debugger. The metrics.log file contains the Call Trace of the call.
Debugging SCXML Files
SCXML files can be tested using the real-time ORS Debugger. Both Run and Debug launch configurations are supported, as well as code mode.
- In the Run mode, call traces are provided and the application continues without any breakpoints.
- In the Debug mode, you can input breakpoints, single-step through the SCXML code, inspect variable and property values, and execute any ECMAScript from the query console.
Tomcat engine is bundled as part of Composer and the application can be auto deployed and auto-configured for testing. Also, if you have not already done so, set ORS Debugger preferences.
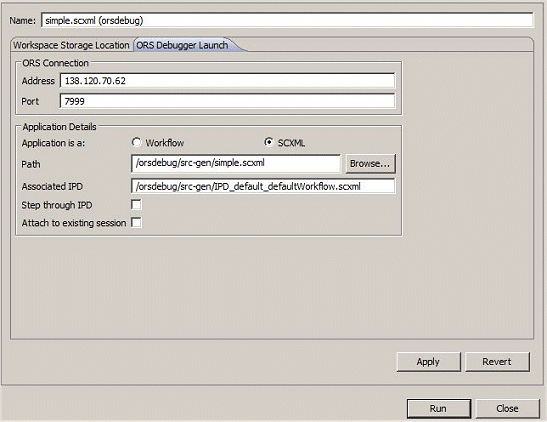
To start debugging, create a launch configuration for the file you want to debug. An example launch configuration is shown below.

To automatically fill in the run launch configuration described below, use launch shortcuts. Right-click on the SCXML file and select Run As SCXML Page. Composer automatically fills in the launch configuration.
Creating a Run Launch Configuration
Note: See Debugging a Workflow Diagram if you want to use breakpoints to step through the file by creating a Debug launch configuration. To test your SCXML Files without breakpoints, use Run Configurations to create a launch configuration:
- In the Project Explorer, expand the Composer Project and its src subfolder.
- Right-click on the SCXML filename in the Project Explorer and select Run As > Run Configurations. The Run Configuration dialog box opens.
- Expand Composer - ORS Debugger.
- Click the button for a new launch configuration or right-click and select New.
- Name the configuration.
- In the Workspace Storage Location tab, specify the Project name and location for saving SCXML pages executed by ORS. This folder appears in the Location field. Or click Create Automatically to have the Debugger create a new Project folder to save the metric traces and SCXML pages as the file is debugged. The files fetched may include SCXML pages, audio files, grammars, scripts, and SCXML data. Call traces are also saved in this location.
- Click the ORS Debugger Launch tab.
- Under ORS Connection, the Address and Port fields reflect the ORS Server Host Name and ORS Server Port previously entered as ORS Debugger Preferences, but can be changed.
- Application is a. Select SCXML. Leave unchecked to step through the SCXML code. Select Workflow to step through a diagram.
- Path. Enter the path for storing files downloaded during a debugging session. Specify the workspace-relative path of the SCXML file. For example, /MyProject/src-gen/IPD_default_defaultWorkflow.scxml.
- Associated IPD. Enter the name of the interaction process diagram (IPD) associated with the SCXML file to be debugged. This field is optional because it is possible to run a stand-alone SCXML. Most of the time, you will use launch shortcuts (right-click on workflow or SCXML and select Run/Debug As). The fields in the launch configurations are filled in automatically.
- Step through IPD. If enabled and debugging in code mode (as opposed to workflow mode), then the Debugger steps through the SCXML code that is generated from the IPD. Otherwise, it will "skip" through that code. The SCXML code generated from an IPD is generally setting up global variables and functions, so you might not want to go through that every time.
- Attach to existing session. If enabled, ORS will start debugging on an existing session. When you launch the debugging session, Composer will prompt for a session ID in a dialog box. Once you enter the session ID, it will enter debugging mode for that session. If not enabled, ORS will wait for the next session that runs the application at a given URL. Note: The URL will point to the SCXML page that should be debugged. ORS will enter debug mode for the next session that is started for this URL.
- Click Apply and Run when ready.
After you launch, debugging does not start until ORS starts the session. You can start the session with a SIP call or multimedia interaction or using the ORS REST API (you need to send a POST request to ORS). Note: If the debugging session cannot be started, a dialog box appears with an error message.
Debugging IPD SCXML Files
Interaction process diagram debugging is not supported. You can debug code generated from an IPD just like any other SCXML page (see Debugging Modes). Prior to debugging, you should have validated the workflow, generated the code, and deployed the Project testing. Also, if you have not already done so, set ORS Debugger preferences. Creating a Debug or Run Configuration The focus is on stepping through the workflow diagrams called from the IPD as the bulk of routing logic and decision making is done at the workflow level. IPD flows are straightforward and in most cases should not require debugging. To debug/run an IPD, you first create a launch configuration.
- In the Project Explorer, expand the Composer Project and its Interaction Processes subfolder.
- Right-click on a workflow diagram, and select Debug As or Run As. This will create a launch configuration automatically and start the debugging session.
- Optionally, at a later time, you can go back to the launch configuration, and check Step through IPD if you want to step through the IPD as well.
- Click the ORS Debugger Launch tab.
- Under ORS Connection, the Address and Port fields reflect the ORS Server Host Name and ORS Server Port previously entered as ORS Debugger Preferences, but can be changed. Address. Enter the IP address or host name of the ORS server. Port. Enter the debugger port of the ORS server. This is defined in ORS configuration as [scxml]:debug-port, and defaults to 7999. Make sure that ORS has debug-enabled set to true as well. Path. Enter the workspace-relative path of the IPD SCXML file. For example, /MyProject/src-gen/IPD_default_defaultWorkflow.scxml.
- Associated IPD. Enter the name of the interaction process diagram (IPD) associated with the SCXML file to be debugged. This field is optional because it is possible to run a stand-alone SCXML. Most of the time, you will use launch shortcuts (right-click on workflow or SCXML and select Run/Debug As). The fields in the launch configurations are filled in automatically.
- Step through IPD. See Step 3. If enabled and debugging in code mode (as opposed to workflow mode), then the Debugger will step through the SCXML code that is generated from the IPD. Otherwise, it will "skip" through that code. The SCXML code generated from an IPD is generally setting up global variables and functions, so you might not want to go through that every time. Note: While debugging an IPD SCXML file, debugging skips over lines that include the workflow SCXML file using the <xi:include> tag. Workaround: None required. Debugging will step into the included workflow diagram or SCXML file.
- Attach to existing session. If enabled, ORS will start debugging on an existing session. When you launch the debugging session, Composer will prompt for a session ID in a dialog box. Once you enter the session ID, it will enter debugging mode for that session. If not enabled, ORS will wait for the next session that runs the application at a given URL. Note: The URL will point to the SCXML page that should be debugged. ORS will enter debug mode for the next session that is started for this URL.
- Click Apply and Run when ready.
After you launch, debugging does not start until ORS starts the session. You can start the session with a SIP call or multimedia interaction or using the ORS REST API (you need to send a POST request to ORS).
Note: If the debugging session cannot be started, a dialog box appears with an error message.
Stepping Through a Routing Application
Note: Step Over on the Debugging Toolbar is the only way to step for both routing and voice applications. Stepping means executing the workflow one step at a time, suspending execution between steps, and using variables, breakpoints, and watch expressions. You can then examine the state of the application when it is suspended. At each step of execution, the Debugger displays metrics (call traces) received from ORS. This topic covers the following:
Suspending Execution
When execution is suspended:
- ORS displays the text of the SCXML page currently being executed.
- Highlights the line that will be executed in the next step.
When you choose to step again, the next step is executed and execution is suspended again. For information on how to step and suspend, see the Debugging Toolbars topic.
Using Variables
The ORS execution context contains ECMAScript variables. Composer access these variables by using the Eval message.
- When execution is suspended, Composer displays the workflow and project variables in the current scope of the ORS execution. The variables are displayed in the Variables tab in ORS Debugging Perspective.
- If the variable is a complex ECMAScript object, You can expand it to view the contents of the object.
- You can create a watch expression from any variable or sub-object of a variable.
For more information, see the Debugging Toolbars topic.
Using Breakpoints
Breakpoints allow you to select a position in the SCXML application to suspend execution. Instead of stepping through execution, You may wish to resume the application, which means to run it until the next breakpoint is reached. You create a breakpoint on a line of the current page. A line breakpoint is reached if the execution reaches the line number of the breakpoint. Line breakpoints are allowed only on SCXML elements which support suspending. The following elements support suspending: onentry, onexit, invoke, transition, script, log, if, assign, raise send, cancel. If you try to create a breakpoint on an unsupported element, the breakpoint is moved to the next valid line. From the Breakpoints View/Toolbar, you can:
- Display a list of all current breakpoints and enable/disable them. If you disable a breakpoint by unchecking the box in the list of breakpoints, then execution is not suspended if that breakpoint is reached. You may also disable all breakpoints by clicking the Skip All Breakpoints action from the Eclipse Run menu.
- Remove a breakpoint.
Breakpoints are saved across sessions.
Using Watch Expressions
You create watch expressions to monitor the value of a given expression. The expression is an ECMAScript expression, e.g., a variable or function call, that is evaluated in the scope of current SCXML application. From the Expressions View/Toolbar, you can:
- Add a watch expression. The value of the expression is displayed immediately, and updated when the value changes.
- Modify the value of a variable in a watch expression. The change is then reflected in the SCXML application context.
- Disable a watch expression. When disabled, the watch expression value will not be updated.
- Remove a watch expression.
Debugging Modes
The ORS Debugger supports two debugging modes: Diagram and Code.
- Launching a workflow in Debug mode starts debugging in diagram mode.
- Launching a SCXML file in Debug mode starts debugging in code mode.
The table below summarizes the modes for different file types. Also see ORS Debugger Limitations.
| Debug File | Mode | Supported | Procedure to Launch |
| Interaction process diagram |
As Code | Yes | Run/Debug as SCXML from an IPD SCXML. When debugging an SCXML file. Composer supports debugging of the SCXML document generated for the IPD diagram. It will not be a common use case to only debug the IPD. |
| Interaction process diagram |
As Diagram | No | IPD debugging is not supported. Code generated from an IPD can be debugged just like any other SCXML page. |
| Workflow | As Code | Yes | Run/Debug as SCXML, from a workflow SCXML. This will basically still run the IPD SCXML but execution will pause at the <AppEntry> state of the workflow SCXML. |
| Workflow | As Diagram | Yes | Run/Debug as Workflow, from a workflow diagram. It will detect the associated IPD SCXML and run that. |
| Sub-Workflow | As Code | Yes | A subroutine cannot be debugged on its own. Put a breakpoint on the subroutine’s Entry block and debug its calling workflow. |
| Sub-Workflow | As Diagram | Yes | A subroutine cannot be debugged on its own. Put a breakpoint on the subroutine’s Entry block and debug its calling workflow. |
| Hand-coded SCXML | As Code | Yes | Should work identical to IPD SCXML debugging. |

