Contents
Workbench Visualizations
Workbench Visualizations is an analysis and visualization component that enables the user to create real-time and historic visualizations of Workbench ingested data; the Workbench Visualizations are then used to build Workbench Dashboards to present the data to the user.
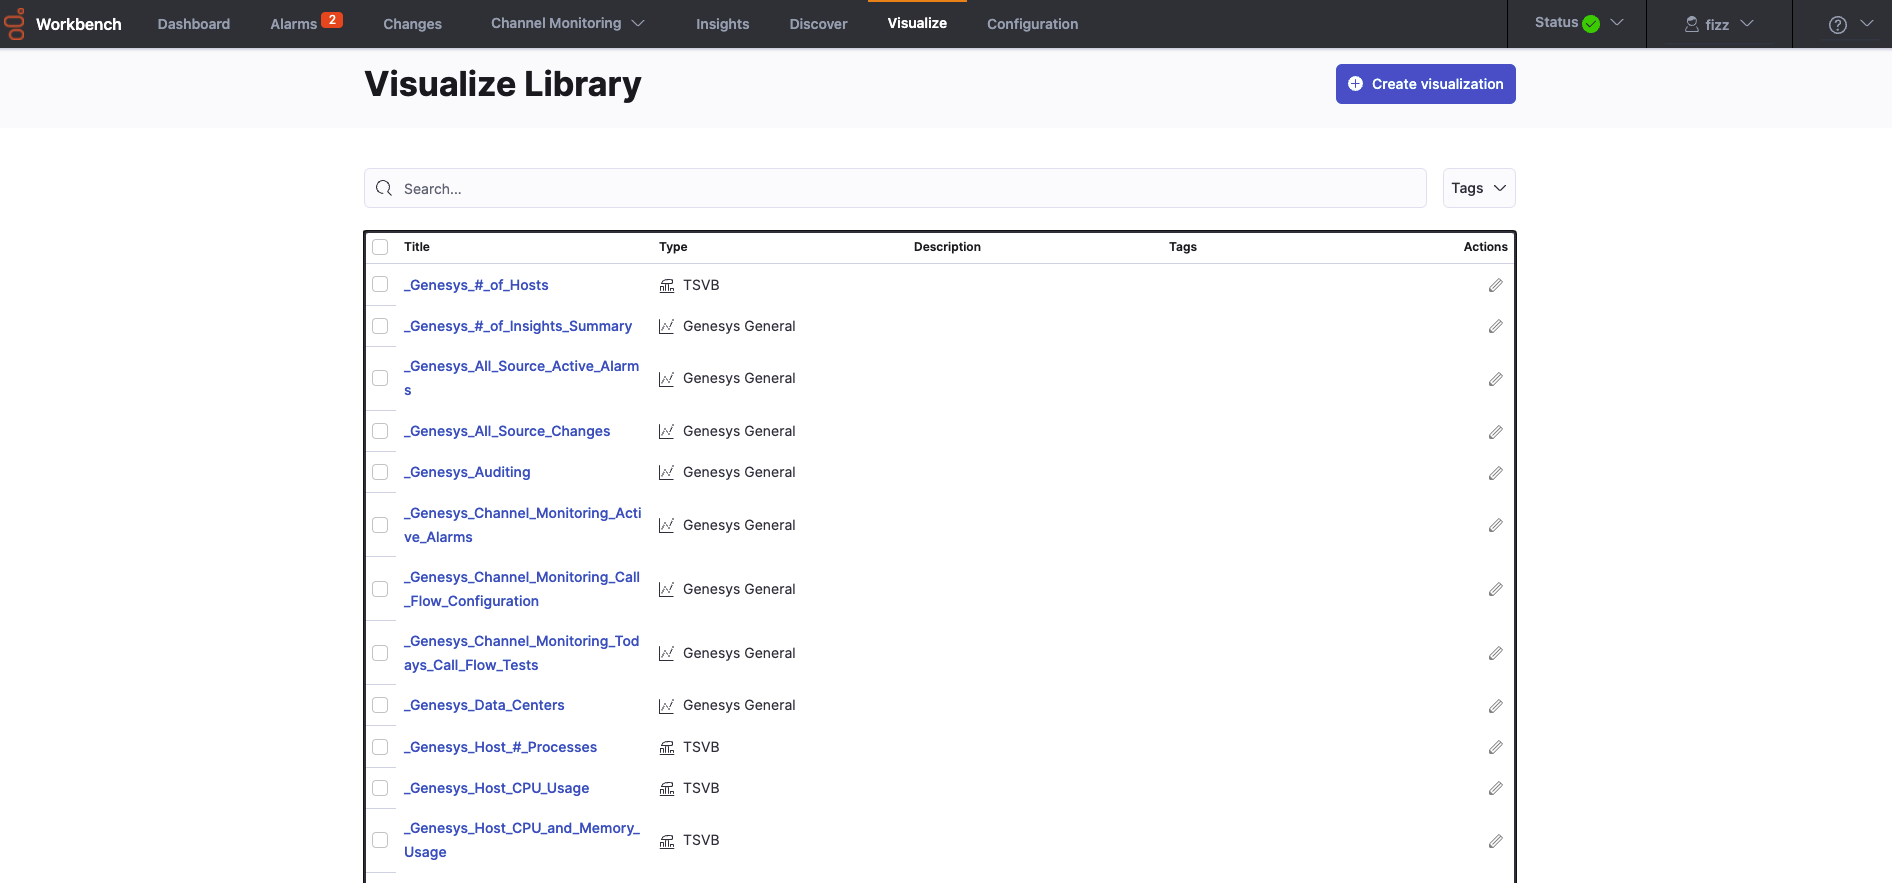
To view and use Workbench Visualizations, click Visualize on the Workbench top navigation bar; post installation Visualize contains 40+ shipped examples to view and utilise.
Visualizations Functionality
With Workbench Visualizations you can:
- Create new Visualizations from the shipped Genesys General and Genesys Health-Maps Visualization Types
- Create new Visualizations from the standard Kibana Visualization Types
- Search for Visualizations
- Save Visualizations
- Share Dashboards
- Clone/Copy Visualizations
- Edit/Customize Visualizations
- Arrange Visualizations within the Dashboards.
- Gain monitoring and troubleshooting insights from the shipped Visualizations and newly created Visualizations.
- Use and learn from shipped example Visualizations.
- View the shipped Visualizations within the shipped Dashboards.
Genesys Visualizations Types
Workbench ships with the following example Workbench Visualizations that are created from the Genesys General Visualization Type:
Genesys General
- Alarms
- All Source Active Alarms
- Workbench Active Alarms
- Genesys Engage Active Alarms
- Changes
- All Source Changes
- Workbench Changes
- Genesys Engage Changes
- Channel Monitoring
- Active Alarms
- Call Flow Configuration
- Today's Call Flow Tests Summary
- Remote Alarm Monitoring
- Alarms Sent to RAM Service
- System Status & Health
- Workbench Status Summary
- Workbench Agents
- Channel Monitoring
- Remote Alarm Monitoring
- Genesys Engage Integration
- Data-Centers
- Auditing
- General
- Insights (Anomaly Detection)
- Workbench Summary
- Workbench Applications
- Workbench Hosts
- Genesys Engage Summary
- Genesys Engage Applications
- Genesys Engage Hosts
- Genesys Engage Solutions
- Genesys Engage HA Pairs
To use the Genesys General Visualization Types:
- Via the top menu bar, navigate to Visualize
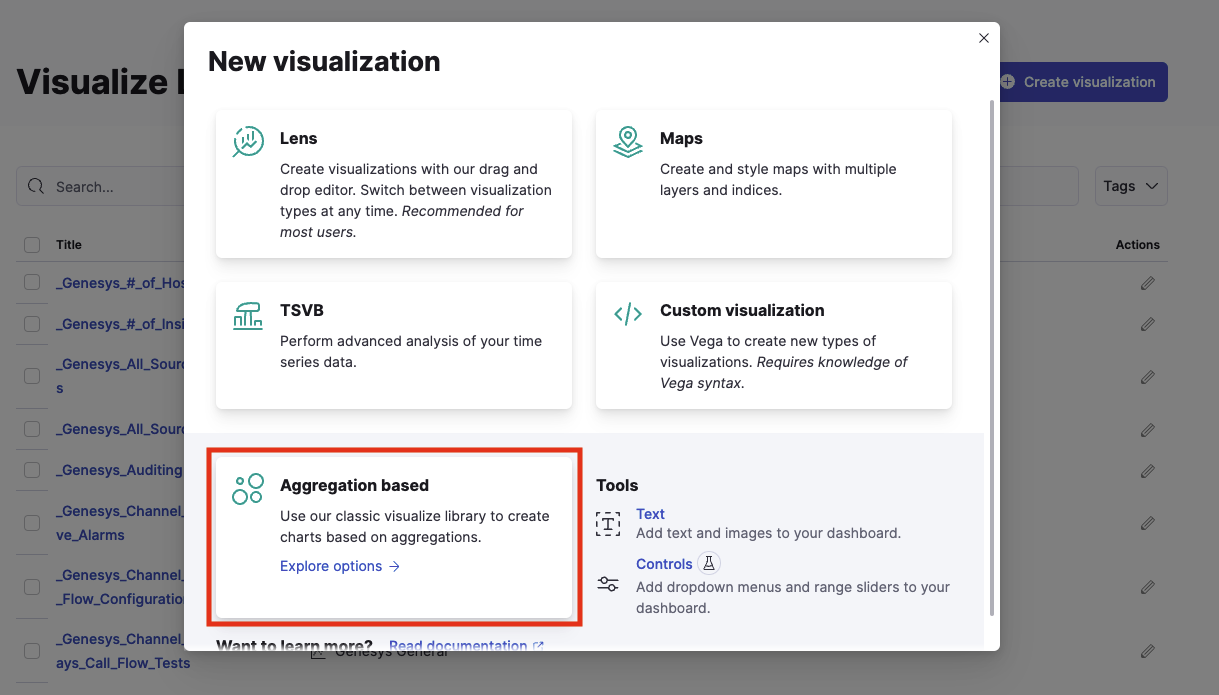
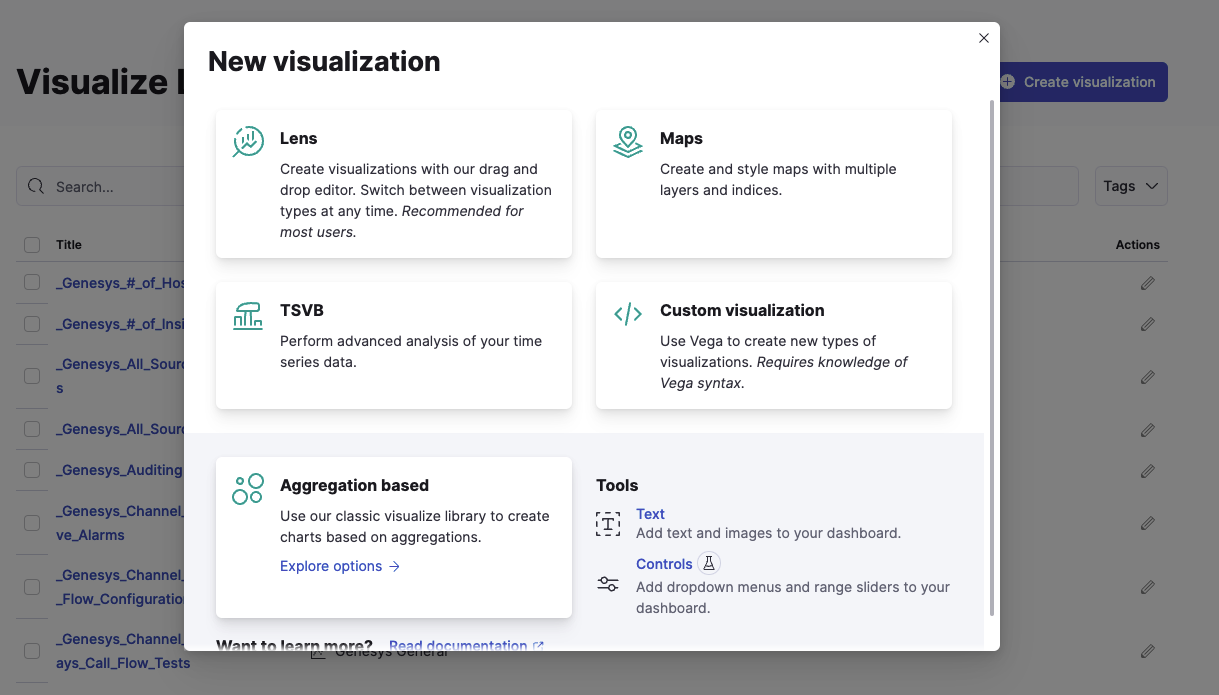
- Click the Create visualization button
- Click the Aggregation based option
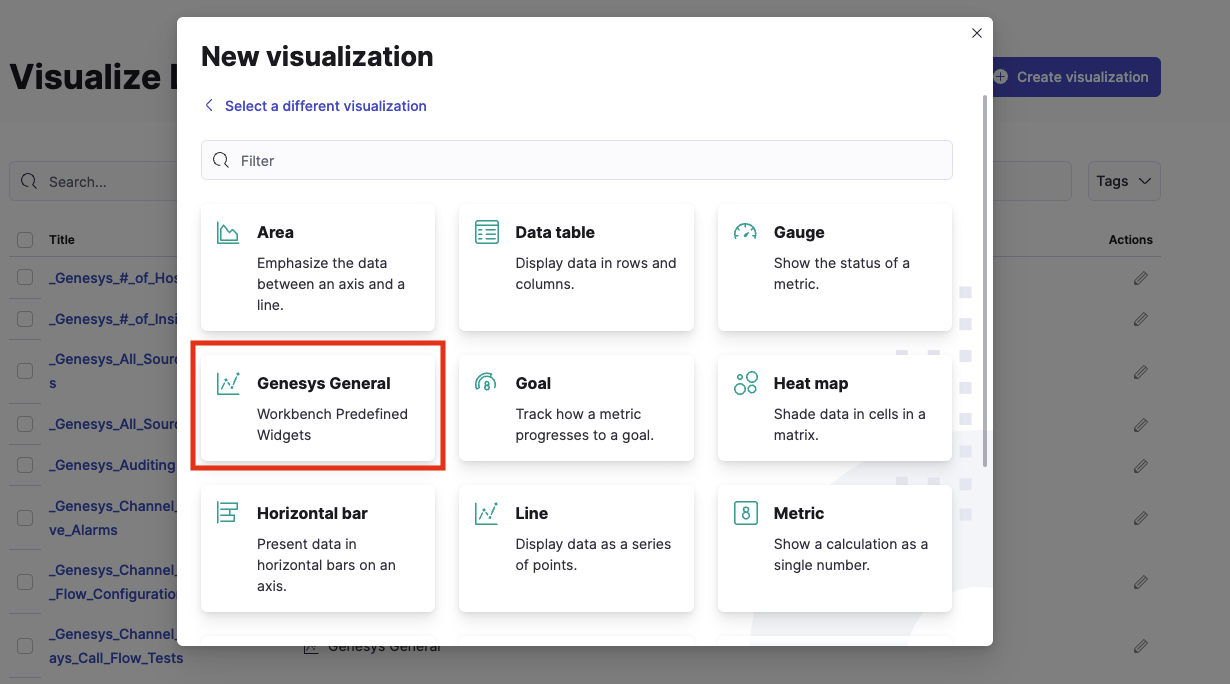
- Click the Genesys General option
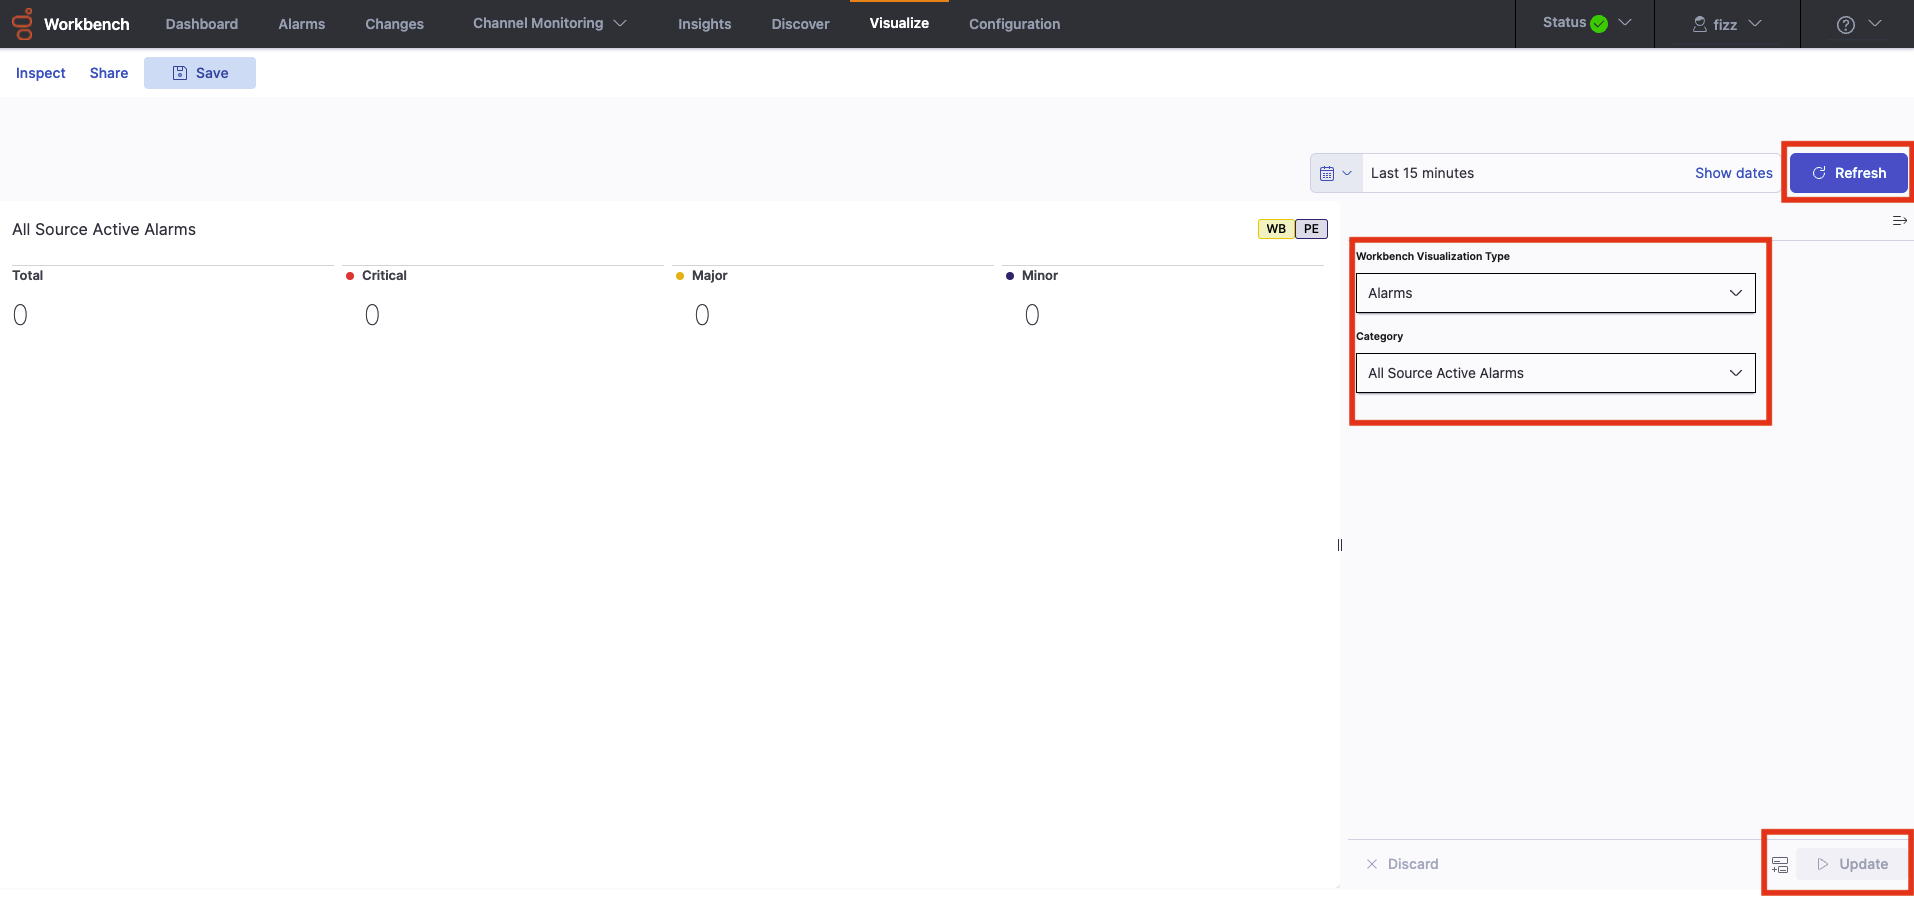
- Use the highlighted options below to select Type, Category, then Update/Refresh to view and refresh the data accordingly
- Click Save to store the Visualization and use in Dashboards
Kibana Visualizations Types
In addition to the shipped Genesys Visualization Types, the user can also leverage the standard Kibana Visualization Types:
Health-Map's
Health-Map's provide a quick and easy status view of:
- Genesys Engage Applications
- Genesys Engage Hosts
- Genesys Engage Solutions
- Workbench 9.0 to 9.2, Health-Maps can only be created for Genesys Engage Hosts, Applications and Solutions; Workbench Health-Maps cannot be created
- Workbench 9.3 does NOT currently support Health-Maps
Please review the below for an example of:
- Creating a new Health-Map for Genesys Engage Chat Applications
- Creating a new Dashboard
- Adding the newly created Health-Map to the new Dashboard
- Saving the Dashboard
- Navigate to Visualize from the top Workbench navigation bar
- Click the + button
- Select Genesys Health-Maps
- Ensure Genesys Engage Applications is selected for the Health-Map Type
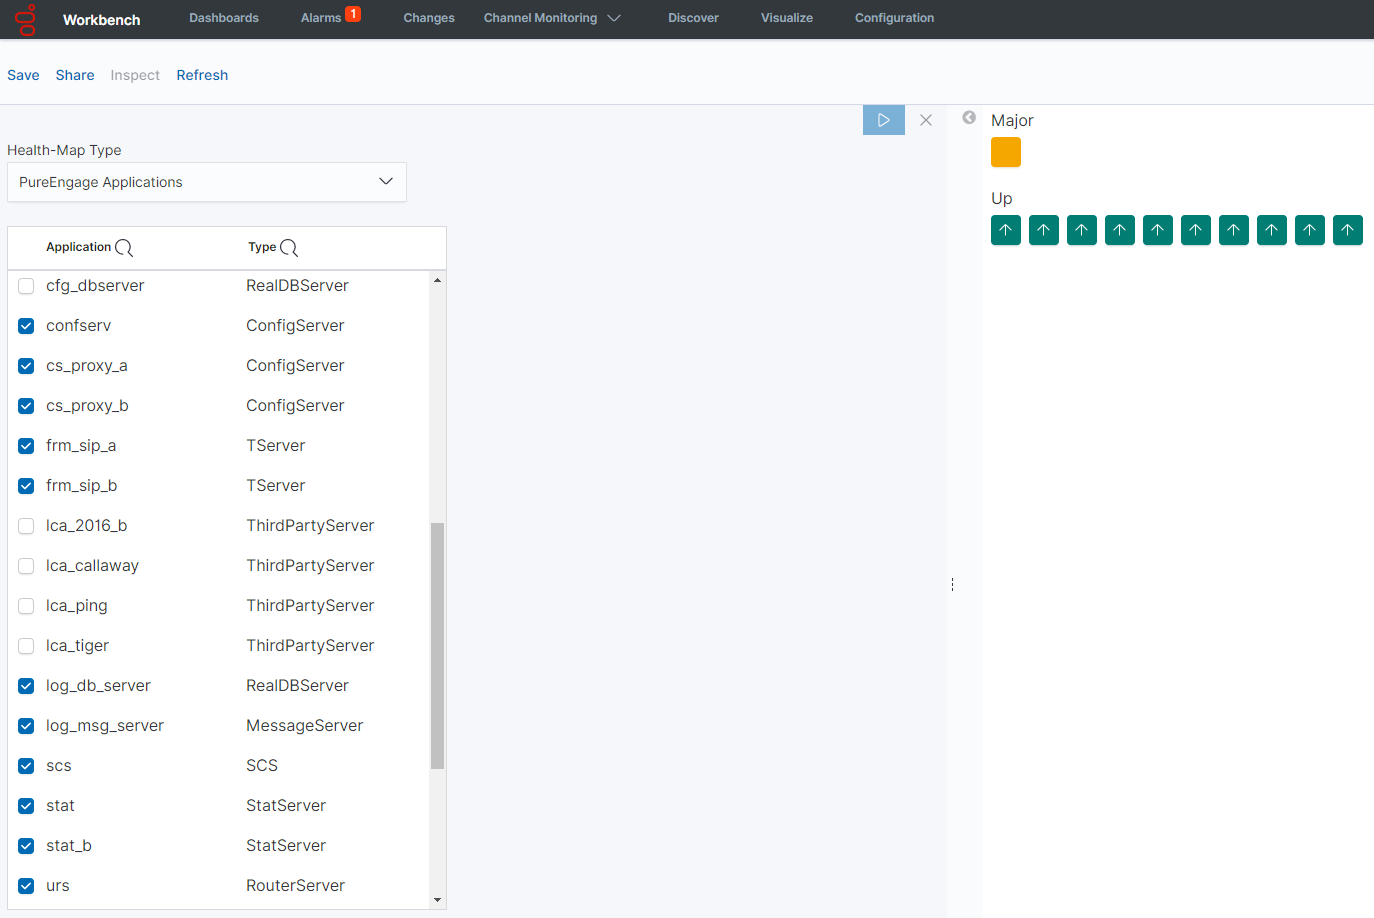
- Check the relevant Genesys Engage Chat Applications you want displayed in the Health-Map
- review example below
- Click the Apply Changes button
- Click Save
- Provide a Visualization name i.e. lab_apps_HM
- Click Confirm Save
- Click Dashboards
- Click Create new dashboard
- Presented with "This dashboard is empty. Let's fill it up!" message
- Click Add to add a Visualization to this Dashboard
- Find and click the HM_Chat_Applications Visualization
- Click the X to close the Add Panels dialog
- The HM_Chat_Applications Visualization has now been added to the Dashboard
- Click Save
- Provide a lab_apps_db and click Confirm Save
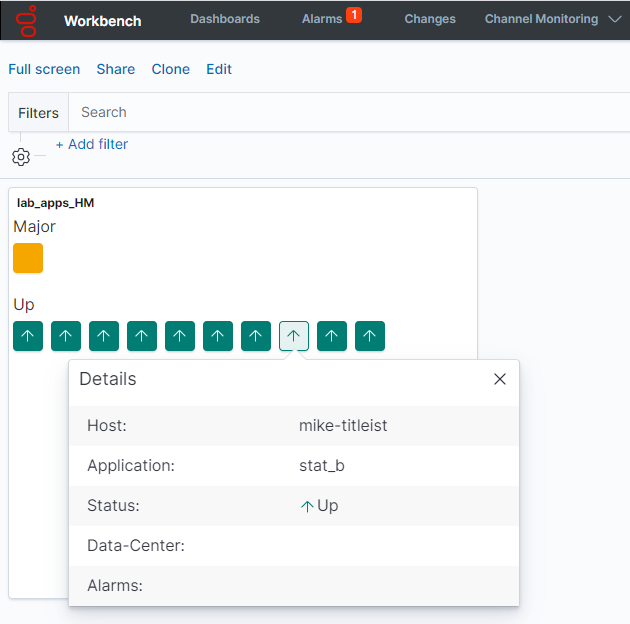
The example Lab Application Health-Map Dashboard is displayed.
Clicking on a Health-Map object will provide additional status context; click X or press ESC to close the pop-up
An example image showing the selection of Lab Applications to include in the new Health-Map:
Considerations
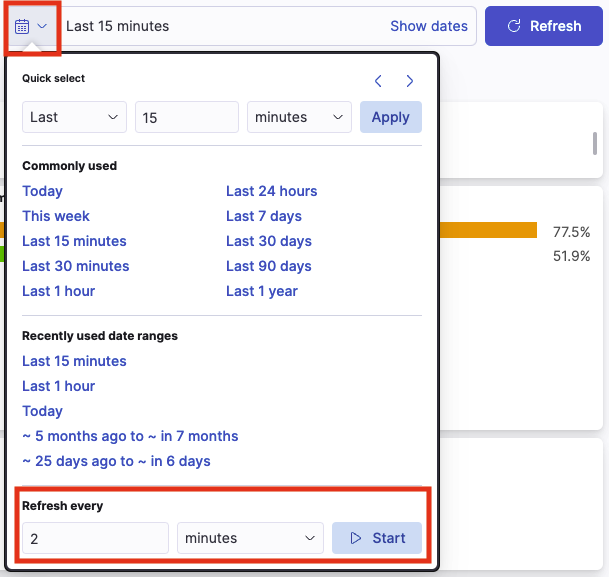
- From WB 9.3+ the Dashboards/Visualizations do NOT update by default in real-time
- Use the 'Quick Select' feature below to 'Start' auto Refresh functionality of Dashboards/Visualizations
- For Workbench 9.2 to 9.3 upgrades, existing Dashboards/Visualizations will be migrated with a "_9.2" suffix
- The migrated "_9.2" Dashboards/Visualizations will not be functional given the changes from Kibana 7.1 to 7.17
- As such, when opening the migrated "_9.2" Dashboards/Visualizations, a Warning icon/message will be displayed
- Even though the migrated "_9.2" Dashboards/Visualizations are not functional and display a Warning, the logic for migrating is to provide context for previously created Dashboards/Visualizations
- Workbench Dashboards and Visualizations leverage the Elastic Kibana component, please review the Kibana documentation (https://www.elastic.co/kibana) for further comprehensive guidance on Dashboards and Visualizations.


