Contents
View Toolbars
The title bar of a view contains a toolbar. This topic describes the following view toolbars:
Project Explorer
The Project Explorer toolbar is shown below.
Each toolbar button is identified in the table below.
| Collapse All
Select to collapse all of the current elements in the view. |
|
| Link Open Editors
When you have multiple files open for editing, select to bring an open file to the foreground (make its editor session the active editor) every time you select that open file in one of the navigation views. |
|
| View Menu
Select to show additional actions for this view.
|
Bookmarks View
The Bookmarks view is shown below.
Each view button is identified in the table below.
| View Menu
Select to show additional actions for this view.
|
|
| Minimize
Minimizes the Bookmarks tab. |
|
| Maximize
Maximizes the Bookmarks tab. |
Canvas View
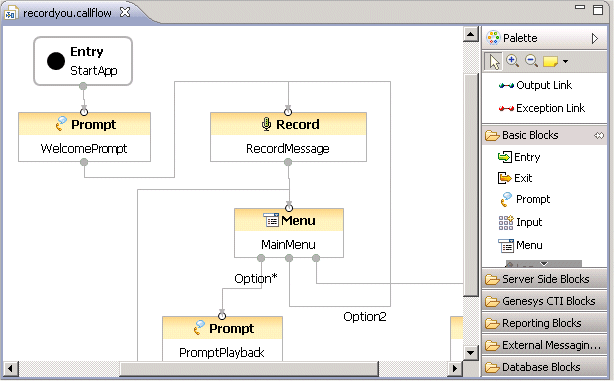
The canvas is where you create callflows for your voice applications and workflows for your routing applications. The Canvas view toolbar is shown below in the upper-right.
Each view button is identified in the table below.
| Minimize
Minimizes the Canvas area. |
|
| Maximize
Maximizes the Canvas area. |
Palette View
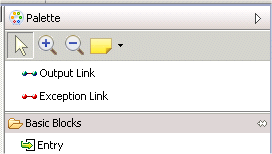
The Palette contains link tools as well as various types of blocks. To create callflow diagrams, the block categories are: Basic Blocks, Server Side Blocks, CTI Blocks, Reporting Blocks, External Message Blocks, Database Blocks, and Context Services Blocks. To create workflow diagrams, the block categories are: Flow Control Blocks, Routing Blocks, Voice Treatment Blocks, Server Side Blocks, eService Blocks, and Context Services Blocks. The Palette view toolbar is shown below.
Each toolbar button is identified in the table below.
| Select
Use to select a block for a callflow or workflow. |
|
| Zoom In
Click left to zoom in, Shift + left click to zoom out, drag to zoom to selection. |
|
| Zoom Out
Click left to zoom out, Shift + left click to zoom in. |
|
| Create Note
Click to create a note, text document, or note attachment. When creating note objects in a diagram there are two ways to create them. After selecting the note tool, you can either click a single point or drag a box to indicate initial size. In the former case, the note will continue to grow horizontally as text is entered. With the latter case, text will automatically wrap text using the input width. |
Properties View
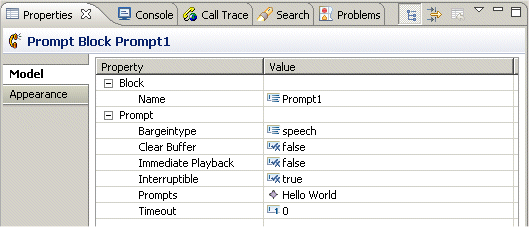
The Properties view shows the properties for a selected block and allows you to set/modify them. An example Properties view and toolbar is shown below.
Each toolbar button is identified in the table below.
| Show Categories
If enabled, method, field and type labels contain the categories specified in their block properties |
|
| Show Advanced Properties
If enabled, the Properties view shows advanced properties. |
|
| Restore Default Value
Use after changing a value in the Properties view to revert back to the default value. |
|
| View Menu
Select to show additional actions for this view: Show Categories, Show Advanced Properties, and Columns. |
|
| Minimize
Minimizes the Properties tab. |
|
| Maximize
Maximizes the Properties tab. |
You can change settings for consoles on the Window Preferences Run/Debug Console page. An example Query Console view is shown below.
Each toolbar button is identified in the table below.
| Clear Console
Clears the currently active console. |
|
| Scroll Lock
Changes if scroll lock should be enabled or not in the current console. |
|
| Pin Console
Pins the current console to remain on top of all other consoles. |
|
| Display Selected Console
Opens a listing of current consoles and allows you to select which one you would like to see. |
|
| Open Console
Opens a new console of the selected type. |
Call Trace View
The Call Trace view displays metrics which describe the events occurring in the application, such as recognition events, audio playback, user input, errors and warnings, and application output. An example Call Trace view and Toolbar are shown below.
Each toolbar button is identified in the table below.
| Call Trace History
Lists past calls. Once you select a past call, shows call trace history for that past call. |
|
| Terminate
Terminates the process that is associated with the current Process Console. |
|
| Filter Metrics
Brings up the Filter Metrics dialog box where you can select the following filters: Platform actions, User input, Application output, Document flow, Errors and warnings. |
Search View
The search dialog lets you perform text string, File, Java, and JavaScript searches. When you first click the Search tab, there is a link to bring up the Search dialog box. The figure below shows the results of an example search and the toolbar.
Each toolbar button is identified in the table below.
| Show Next Match
Shows the next items that meets the search criteria. |
|
| Show Previous Match
Shows the previous item that met the search criteria. |
|
| Remove Selected Matches
Removes matched items that you have selected from the results . |
|
| Remove All Matches
Removes all matches from the results. |
|
| Expand All
Select to expand all of the current elements in the view. |
|
| Collapse All
Select to collapse all of the current elements in the view. |
|
| Run Current Search Again
Repeats the search with currently-defined parameters. |
|
| Cancel Current Search
Cancels the current search. |
|
| Show Previous Searches
Displays a list of previous searches. |
|
| Pin the Search View
Pins the current search view to remain on top of all other views. |
|
| View Menu
Select from the following: Show as List, Show as tree, Filters, Preferences. |
As you work with resources in the workbench, various builders may automatically log problems, errors, or warnings in the Problems view. For example, when you save a Java source file that contains syntax errors, those will be logged in the Problems view. When you double-click the icon for a problem, error, or warning, the associated block is highlighted in the canvas area. Also see topics Diagram Validation and Validating a Single Flow Diagram.
Problems View
An example Problems view with toolbar is shown below.
Each toolbar button is identified in the table below.
| View Menu
Select to show additional actions for this view. Show: All Errors, Warning on Selection, Show All. Group By: Java Problem Type, Type, JavaScript Problem Type, Severity, None. Sort by: Description, Resource, Path, Location, Type, Ascending New Problems View Configure Contents. Opens a window where you can filter the contents of the Problems tab. Columns. Opens a dialog box where you can set the width and move the following columns up and down: Description, Resource Path, and Location. Preferences. Opens a dialog box where you can hide and show the following columns: Description, Resource, Path, Location, Creation Time, ID, Type. |
|
| Minimize
Minimizes the Problems tab. |
|
| Maximize
Maximizes the Problems tab. |
Statistics Manager View
The Statistics Manager view lets you easily create, delete, and organize created statistics into folders.
Each toolbar button is identified in the table below.
| |
Add New Folder
You have the option of creating folders to organize statistics that you create. Click this button to create a new folder. |
| Add New Statistic
To build a new statistic, select a folder and click this button to bring up Statistics Builder. |
|
| Delete Selected Item
To delete a statistic that you have created, select the statistic and click this button to delete. |
Help View
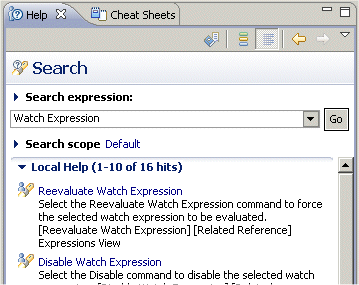
The Help view shows the following toolbar after selecting Search from the Help menu.
Each toolbar button in the Help view is identified in the table below.
| Show All Topics
Select to display all available Help topics. |
|
| Show Result Categories
Select to display the categories for the Help results. |
|
| Show Result Descriptions
Select to display the descriptions of the Help topics. |
|
| Back
Move back through topics. |
|
| Forward
Move forward to next topic. |
Once you select a topic, the toolbar changes as shown below.
Each toolbar button is identified in the table below.
| Show All Topics
Select to display all available Help topics. |
|
| Show in External Window
Select to display the results in an external window. |
|
| Show in All Topics
Select to display the results in all topics. |
|
| Print
Select to print the results/topic. |
|
| Bookmark
Select to bookmark the results/topic |
|
| Highlight Search Term
Select to highlight a search term. |
|
| Back
Move back through results. |
|
| Forward
Move forward to next result. |


